|
Introduction Hello all, as the bulk of Hurricane Season quickly approaches, I thought I would stop procrastinating and finally create my seasonal forecast for the 2020 Atlantic Basin. The official start date for the basin is June 1st and the official end date is November 30th, however storms can form outside of those defined boundaries as we saw with Tropical Storms Arthur and Bertha. In this forecast, I will talk about some of the key indicators that drive the activity in this basin and what they are showing for this upcoming season. In addition, since I’m merely a college student as well as this being the first seasonal forecast that I will have made, don’t take this forecast for verbatim, use it more as a reference or guide. Most importantly, make sure to always follow your local NWS office or the National Hurricane Center for the most up to date forecasts on tropical cyclones. My Predictions For the 2020 Atlantic Hurricane Season I’m expecting an above-average season with an increased number of storms as well as a higher than normal Accumulated Cyclone Energy (ACE) for the season. Named Storms: 15-19 | Yearly average of 12 Hurricanes: 7-10 | Yearly average of 6-7 Major Hurricanes: 3-5 | Yearly average of 2-3 ACE: 160 (+/- 20) | Yearly average around 106 El Niño Southern Oscillation To start off, I’ll talk about what most people have already heard about, the El Niño-Southern Oscillation (ENSO) state or more commonly known as El Niño or La Niña. Whether or not we are in an El Niño or La Niña state will have large impacts on the weather in all reaches of the globe. In simple terms if we are in an El Niño regime, that means that the waters directly west of Peru extending into the Central Pacific are warmer than average, and vice versa with a La Niña regime, the waters would be cooler than normal for that part of the ocean. As a result, precipitation, wind and temperature across the globe are all affected by this phenomenon. Figure 1 shows how convection in an El Niño state can create more uplift and convention over the Pacific Ocean while in La Niña convection moves further east towards the Atlantic basin. Going back to the current state of the Pacific, it’s currently neutral, neither in a warm El Niño or cold La Niña phase. The Climate Prediction Center (CPC) predicts that by the peak of the Hurricane Season in August/September or October, a La Niña may form, or neutral-cool conditions will persist (Figure 2). I believe that we’ll be in a weak La Niña by then as in figure 3 due to an easterly wind burst (EWB) the sea surface temperatures (SSTs) are already dropping in the main region where we measure the ENSO state. With a La Niña environment, we will see increased easterly trade winds (winds that move east) over the Atlantic which would help to reduce shear in the Main Development Region (MDR). With a La Niña environment the trade winds will warm up the Indo-Pacific pool which promotes rising air in the region which enhances the walker circulation which in turn would enhance the La Niña even more. 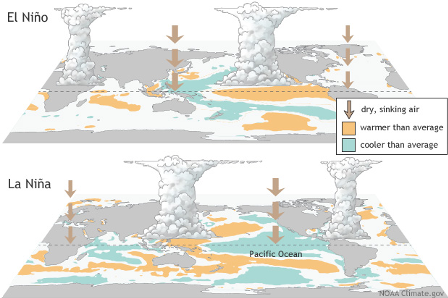 Figure 1 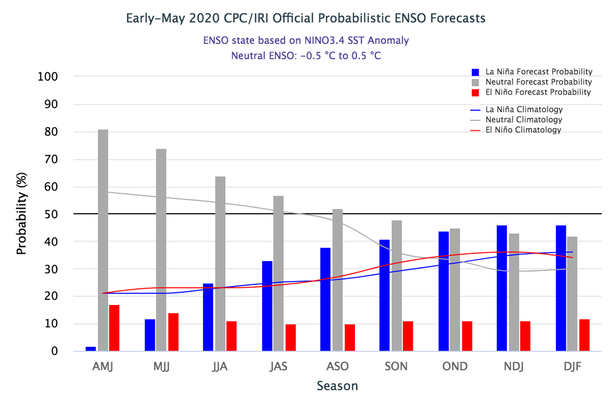 Figure 2 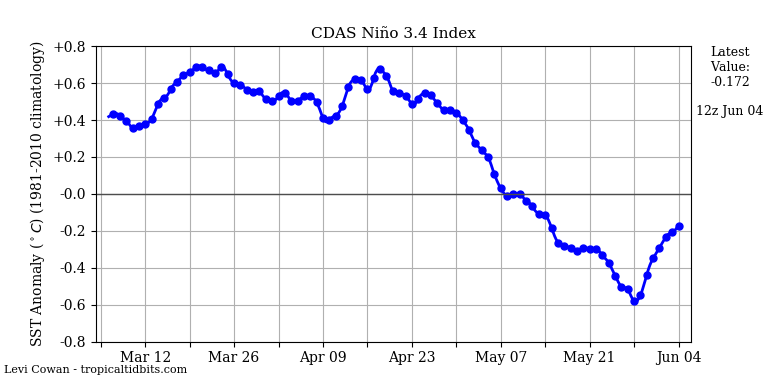 Figure 3 Sea Surface Temperatures Sea Surface Temperatures, often shortened to the acronym of SSTs tells us how warm or cold a body of water is. This is important because Hurricanes and most tropical storms require a minimum of 27 Celsius or 80 degrees Fahrenheit to form or develop. The warmer the waters, the more likely a storm is able to intensify as tropical cyclones use evaporation in their latent heat release to fuel themselves and the warmer the water, the more water that can evaporate for latent heat release. In figure 4 we see that the Atlantic for the most part is around to normal to slightly above normal in terms of SSTs. The main things to notice are that the subtropics are warmer than normal, while the MDR is a mixed bag and the Gulf of Mexico/Caribbean is warmer than normal. Once the West African Monsoon (WAM) gets going, we may see a warmup of the MDR right before the main tropical cyclone season which begins in July and August. The WAM is a term used to describe the monsoon type climate that affects Western Africa like the name implies. The reason why it's so important is because it helps with providing the Atlantic basin with more robust tropical waves which can either survive longer or are already organized once they leave the continent. Due to a more active West African Monsoon (WAM) which is due to an anomalous SST gradient between the Equator and 20N, it’ll enhance a favourable trade wind pattern that will create a more active WAM, alike to 2019. That being said, the Atlantic may warm or cool on a moment's notice as we saw with the GOM. In mid-April it, was at record warmth and then a month later it was much cooler. Factoring that in, I still believe that this general pattern of a warm Atlantic will stick around for the August/September/October time frame (The heart of the season) which would allow for a more active season. 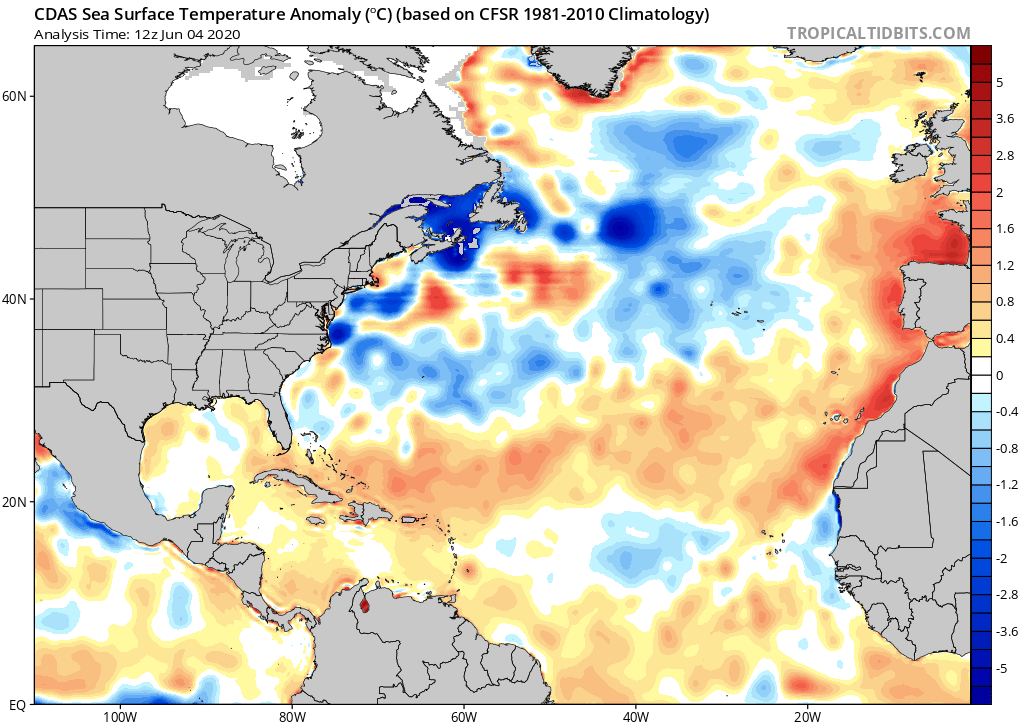 Figure 4 Atlantic Multi-Decadal Oscillation The Atlantic Multi-Decadal Oscillation (AMO) is a process of variability which takes about 60 to 80 years to complete a full cycle. It is determined by averaging the SSTs of the North Atlantic from the equator to the Arctic. In figure 5 we see that about every 30-40 years the AMO switches from positive to negative or vice versa from negative to positive. You may be asking why is the AMO important? Well, the AMO can be used to help predict the climate in North America and Europe, ice anomalies and in this case Hurricane Activity within the basin. There is a strong correlation between there been more active years in positive AMO years and less active in negative AMO years as shown in figure 6. As we are currently in the warm phase of the AMO, this lends credence to the possibility of another active year in 2020. Obviously, there are some years where the correlation isn’t as strong such as in 2013 or in 1997, but the overall picture paints a positive correlation between the AMO and the activity in the Atlantic Basin which should continue this year. 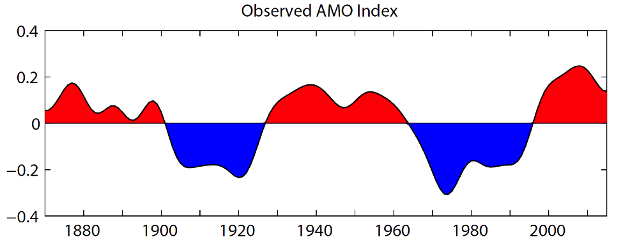 Figure 5 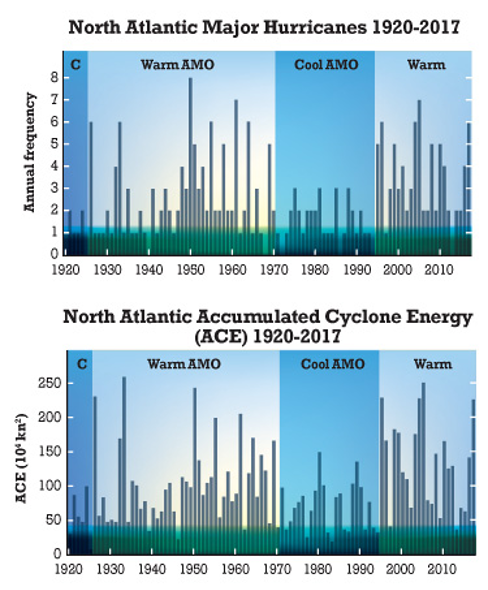 Figure 6 Atlantic Meridional Mode The Atlantic Meridional Mode (AMM) in short is the variations of the SSTs and 10 meter winds within the Atlantic in both the Northern Hemisphere and Southern Hemisphere extending from 21S to 32N and from 75E to 15W. The reason why this is important is because the resulting SSTs difference between the two hemispheres help to move the Intertropical Convergence Zone (ITCZ) towards the warmer hemisphere which would be the warmer basin in terms of SSTs. In addition to this, over the warmer hemisphere, trade winds will be lessened which in turn warms up the water even more to the already warm waters creating a small positive feedback loop. While the latest data hasn’t been updated since March, the AMM value should be higher now as the waters in the data range are above average which would lead to an +AMM which would move the ITCZ further into the Northern Hemisphere. That being said the ITCZ (figure 8) is slightly south of its usual location at this time of the year which would indicate that the AMM is still neutral or even negative for the time being. This isn't a big deal for June or early July as the ITCZ is usually too far south for many waves to take advantage of the position since the coriolis effect (The force that helps tropical storms rotate in a cyclonic motion or counter-clockwise). This becomes much bigger in August and September when most of the storms are born from tropical waves off of the ITCZ and the location of it does matter more. 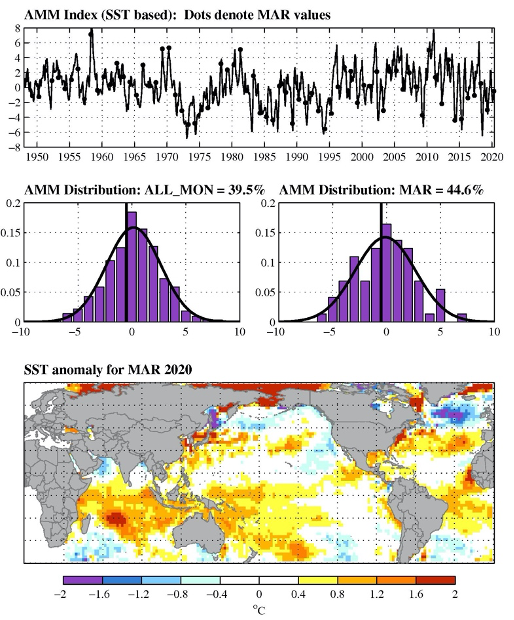 Figure 7 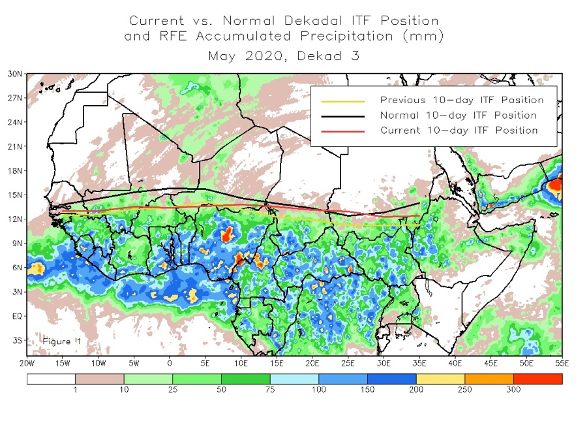
0 Comments
|
AuthorHello, my name is Kaylan. I'm currently a sophomore at the University of Wisconsin studying Atmospheric and Oceanic Science. I have had a passion in the weather for as long as I can remember and hope to continue it into the future. Archives
December 2020
Categories |
 RSS Feed
