|
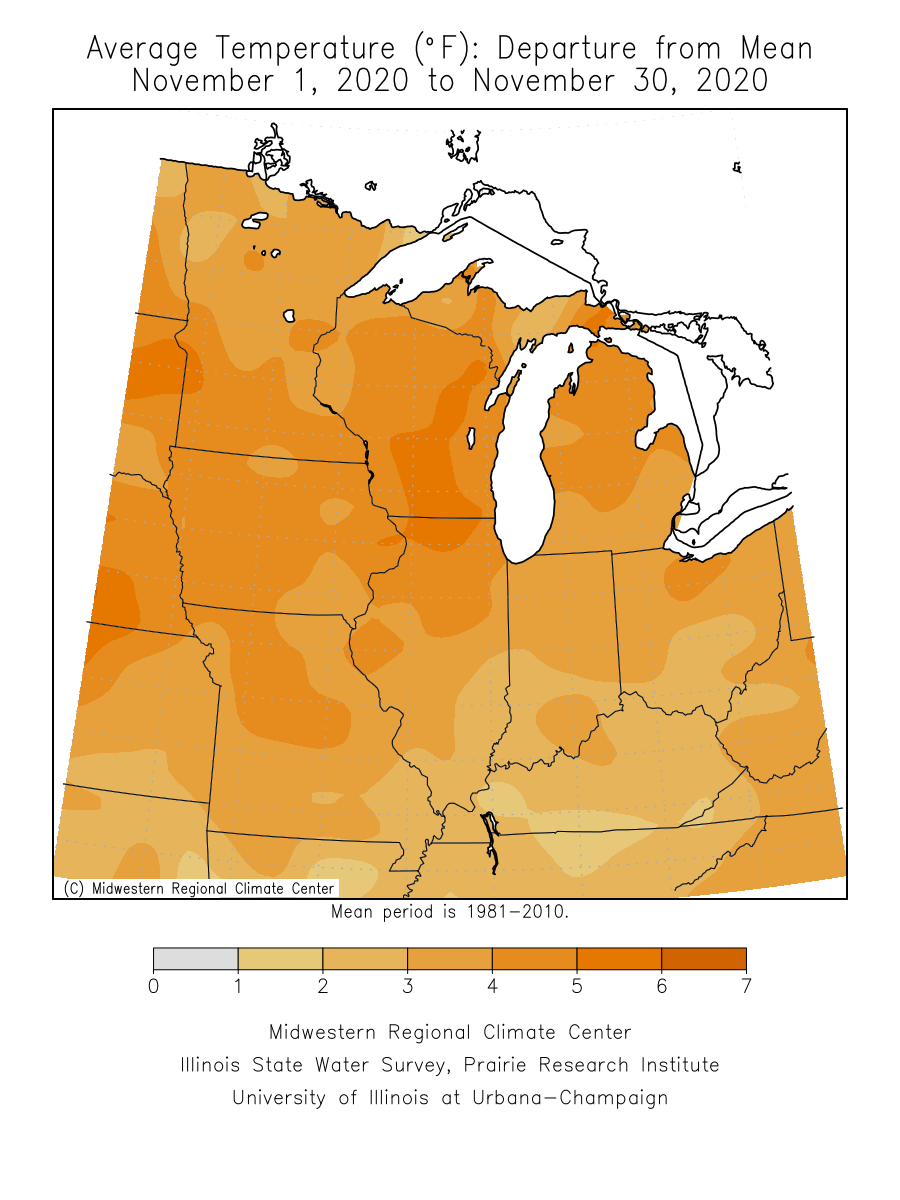
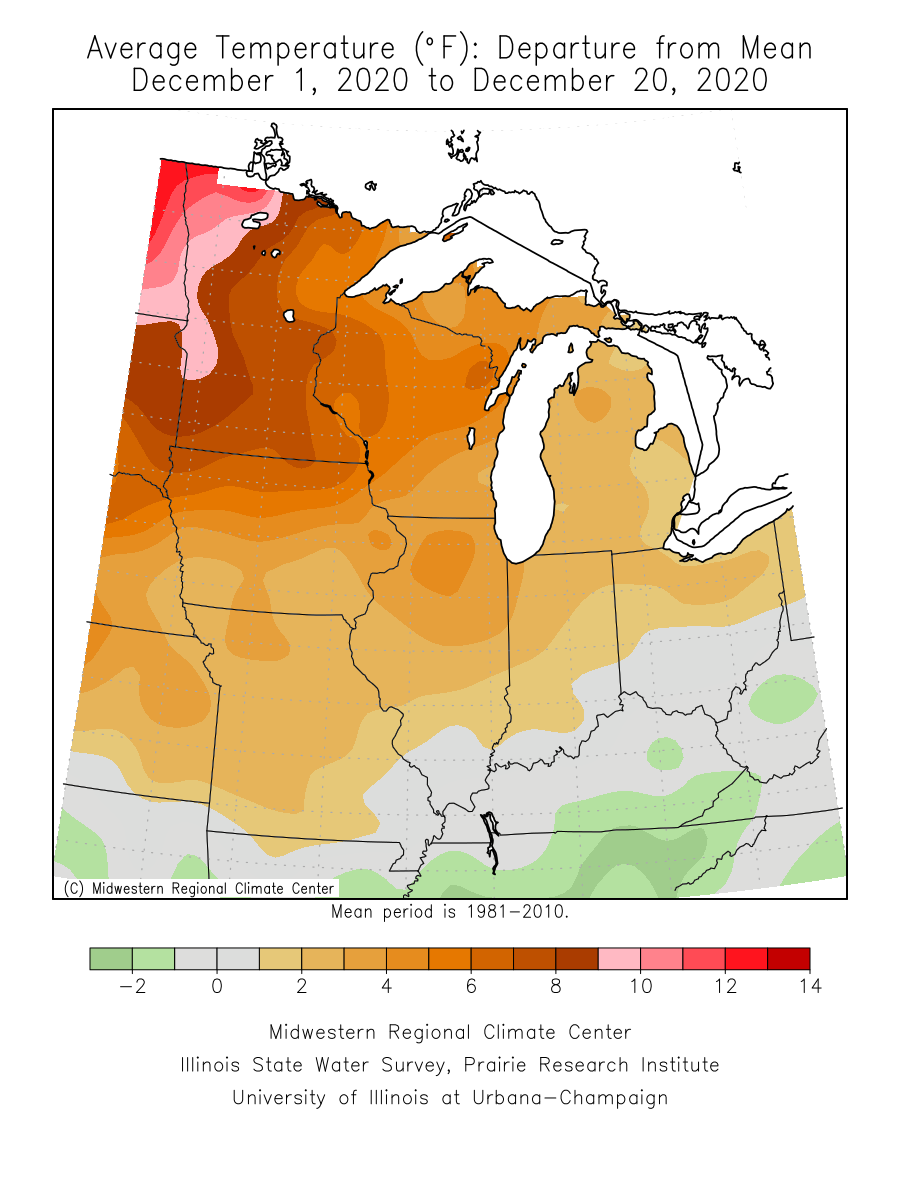
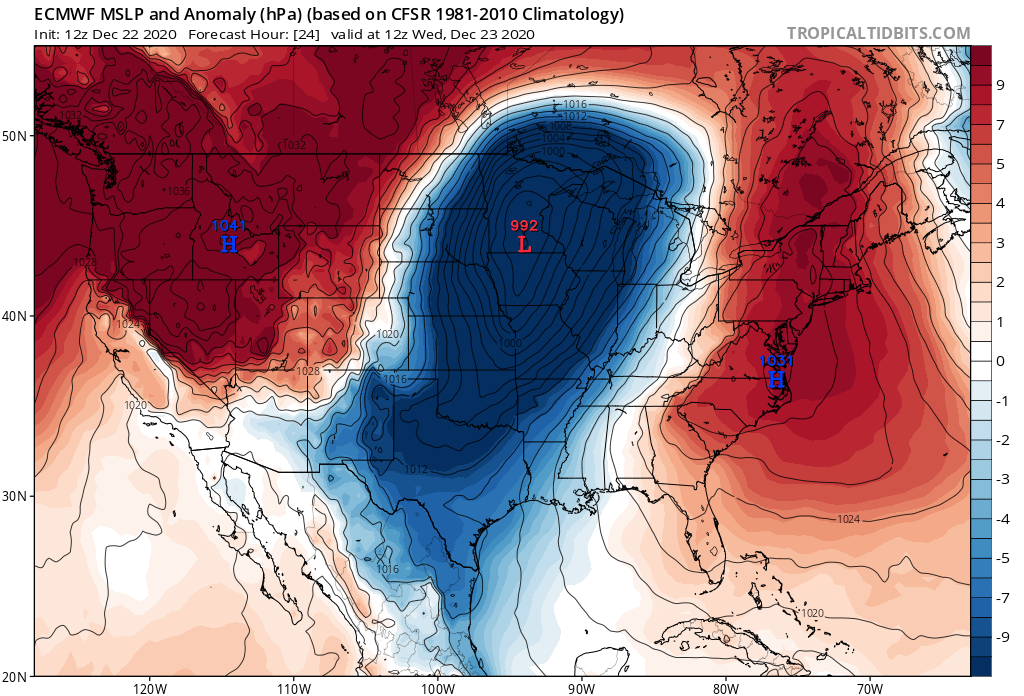
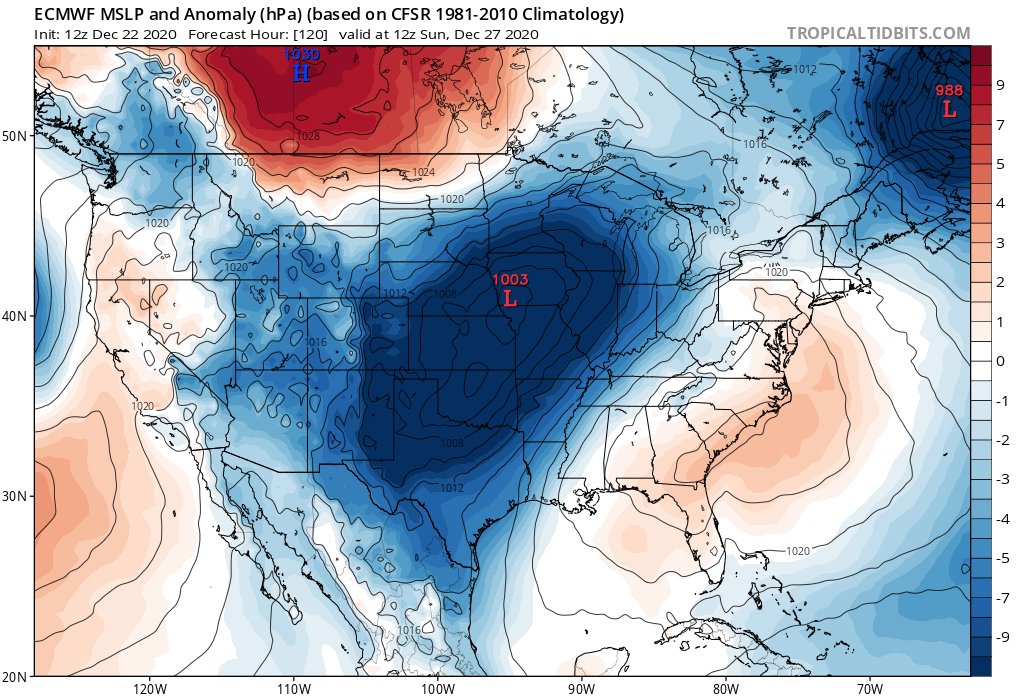
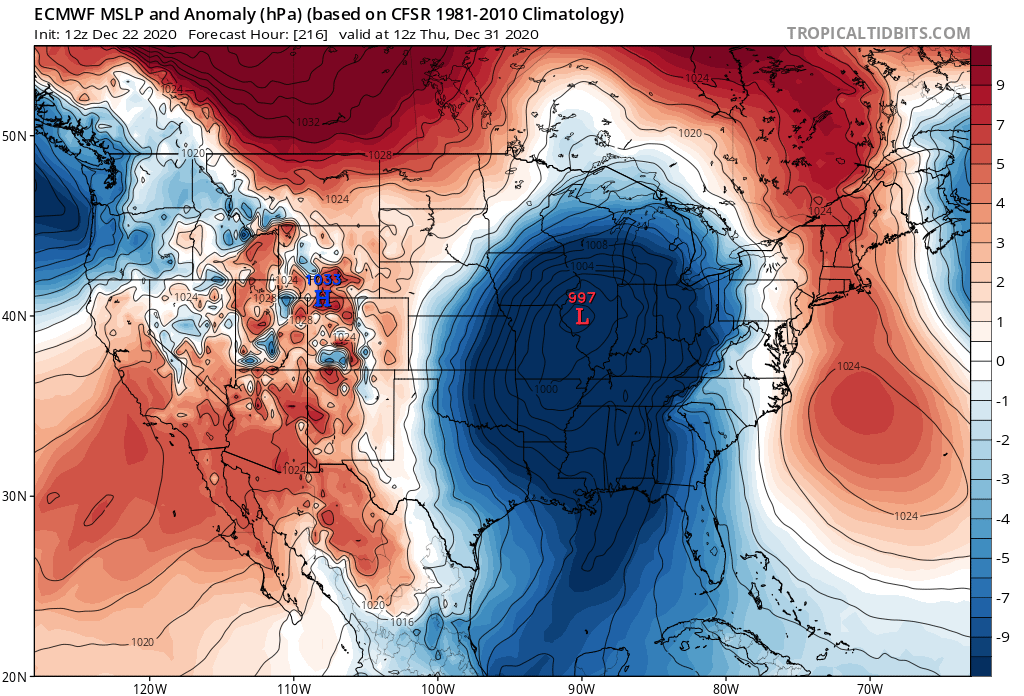
Preface: I wrote most of this blog on the 21st of December but was busy and wasn't able to publish until late on the 23rd so some timing and model runs might be off. That being said the general picture will remain the same on all the points and facts I listed below. So far this winter, much of the Midwest and more specifically Chicago, has gotten very little snowfall. Many locations in the vicinity of the Great Lakes are running at 10-25% of the usual snowfall up to December 20th with temperatures also running much warmer than normal. In this blog I'll be looking at what has caused so little snow to fall, as well as, if any relief is possible for snow lovers in the coming weeks. Winter so far: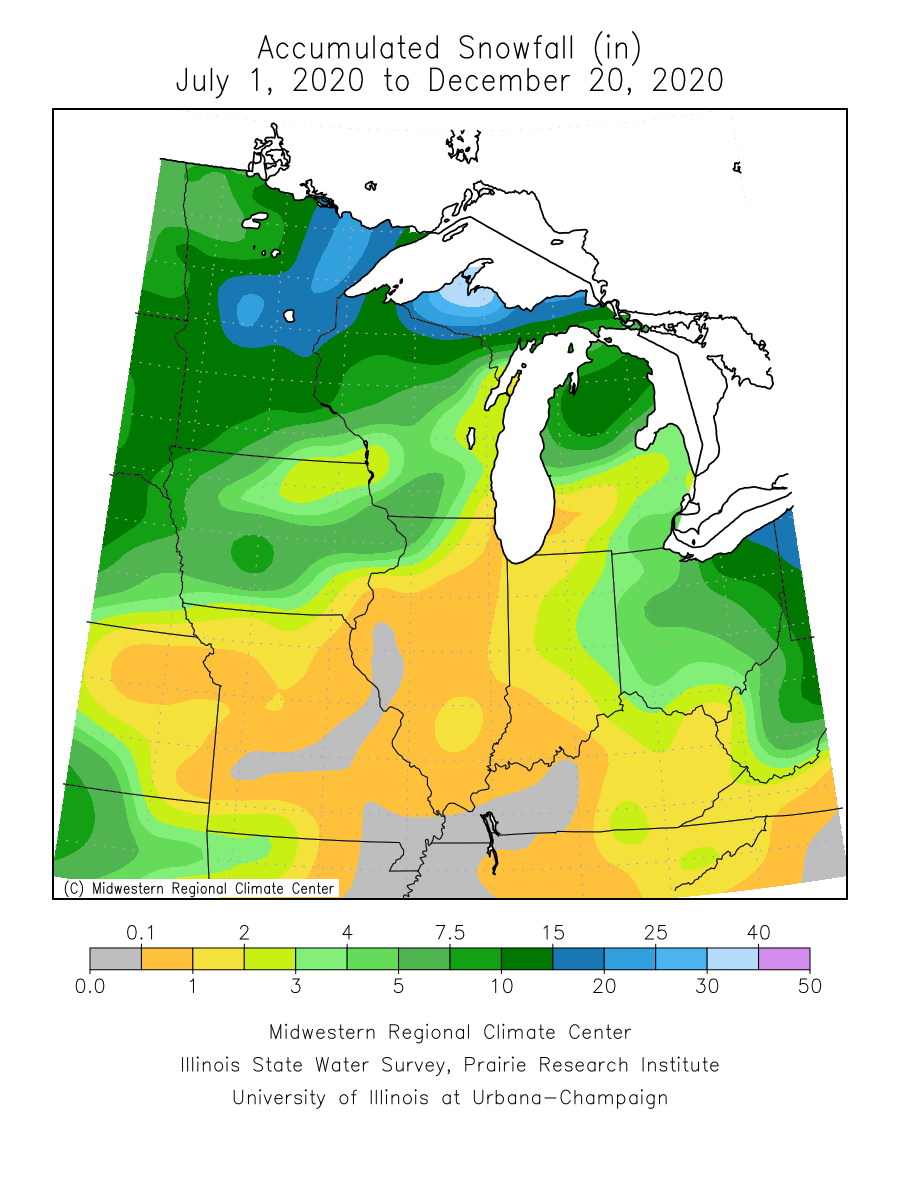 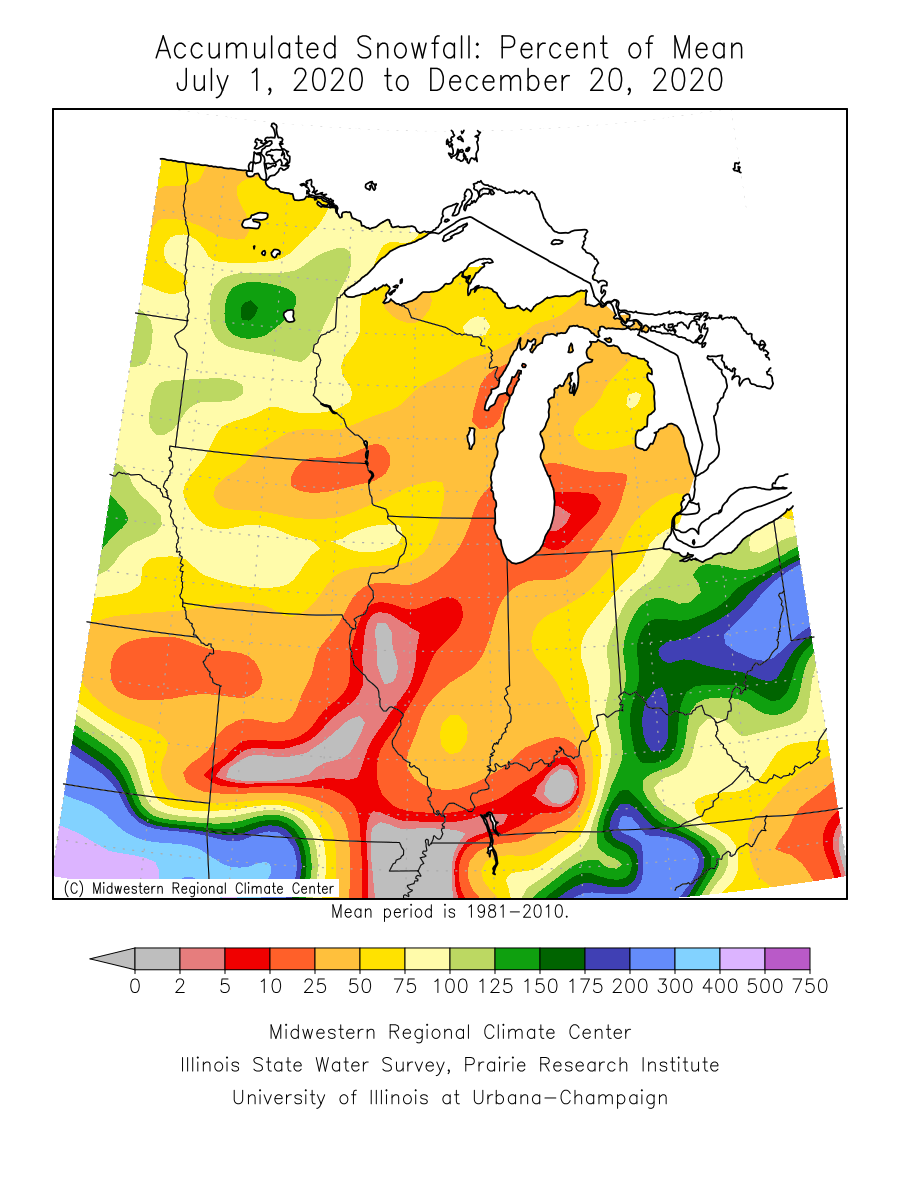 From the graphics above, you can see that there is a snowfall deficit for much of the Midwest. The further NW and SE from Chicago you go the less of a deficit there is. Right smack dab in the middle from essentially Missouri to Michigan is an area of next to no snowfall with the highest deficits maximized in the St Louis to Chicago and up to Milwaukee corridor. Much of the area have received less than an inch of snow to date which equates to under 25% of the normal tally. On top of the lack of snowfall, temperatures in the region have been much warmer than usual which has helped caused a few of the storms that have tracked through the region either to be completely rain or quickly transition to a rain with little accumulation of snow. The images below show that much of the midwest has been 3-6 degrees warmer than normal over the last two months with December especially warmer than usual. By using the Accumulated Winter Season Severity Index which incorporates a variety of factors such as temperature, snowfall and snow depth to create a numeric value for how a winter was, you can determine how harsh or mild a particular winter was. The higher the number the worse the winter and vice versa with a low number with it being a mild winter. From the image below we can see that much of the midwest is in the mild tier with Chicago near a record low value for this date. The image on the right shows the current AWSSI for Chicago and 5 seasons closest to it and how the rest of the season played out. As you can see most ended up in the moderate to mild range which isn't a good sign for those snow lovers out there, including me. 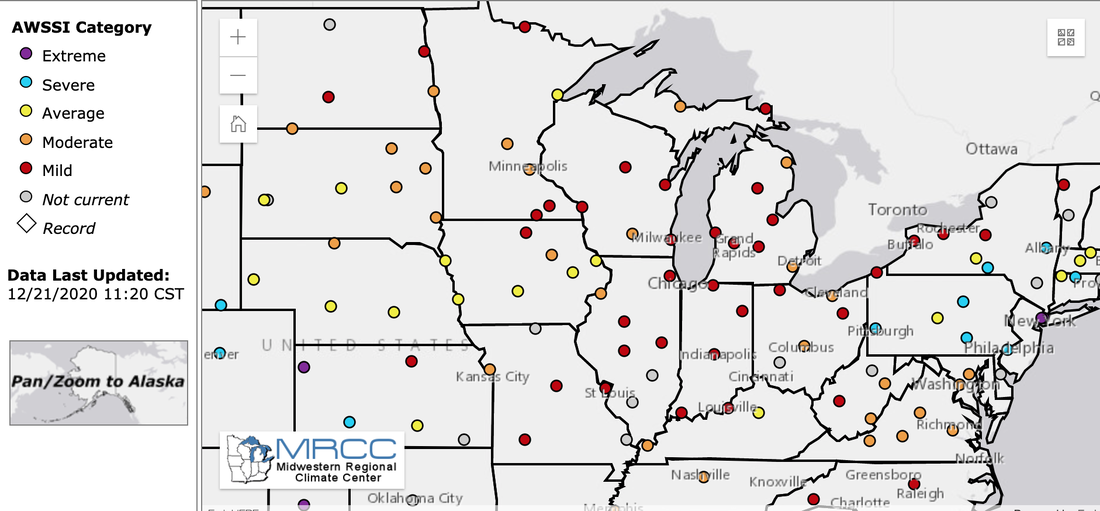 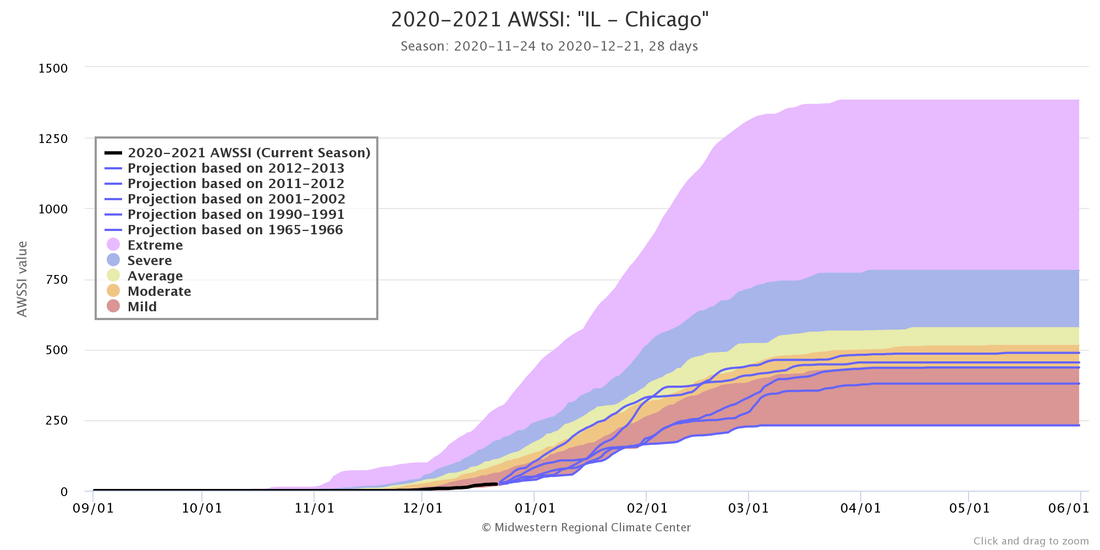 You might be asking yourself what has caused the temperatures to be this warm and by effect have little snowfall. Well, it falls on the upper level pattern we've experienced over the last 8 weeks. This particular pattern has caused much of the cold air to be locked up in Canada while storms would track to the south and east of the Great Lakes. Starting with the jet stream, it was in an unfavourable location for cyclogenesis/storm development over the Midwest. A polar jet well to the north which prohibited cold air from moving south and a subtropical jet well to the south prevented good moisture from reaching too far to the north to help the few storms that did track through the area. On top of that, you had a positive Eastern Pacific Oscillation (+EPO) and positive Pacific-North America Index (+PNA) regime which flooded the continent with mild Pacific air. This in turn helped to moderate the few cold outbursts that occurred earlier in the season. The +PNA and +EPO regime also helped to create a strong Jet Stream over the Pacific and cause an extension of the Jet stream. Due to the orientation of the jet stream in Canada, it helped by way of negative vorticity advection to create a ridge over much of the Upper Plains. This forced the cold air to not only remain in Canada but cause winds to trek over the Mountains which forced them to warm as they descended in the plains warming up the area even more. 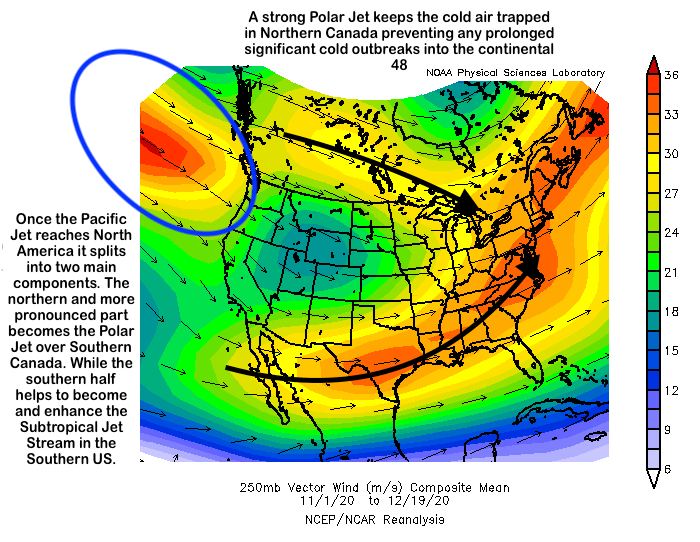  So what is in short term future? Looking ahead to the next two weeks, there are 3 main events that models are picking up on. The first one on Dec 23-24th, the next one on Dec 27-28th and lastly the third will likely occur around the December 30- January 1st time period. The first event, which will happen in the next 36-48 hours will likely be a pattern changer for the time being. While it won't bring accumulating snow, if any at all, it'll bring down the first true cold shot of the year with temperatures struggling to get out of the teens on Christmas Day. The next event won't be a major storm from the looks of it. A shortwave disturbance from Canada will progress E/SE slowly organizing as it goes. From the looks of it, it'll truly become a decent storm when the proper phasing occurs well east of the Great Lakes which is of little importance to Chicago and the Midwest. As of right now it looks with the lack of a true Arctic High to our north, it'll be mild which means that if precipitation does indeed fall, Chicago will be near or at the freezing line so another rain event is possible. The last event before the new year is probably the most enticing out of the three for snowfall prospects. A trough will dig through the Pacific SW and then move slowly to the NE towards the Great Lakes while allowing for cyclogenesis over the central plains. Models vary in the intensity of the digging trough which would decide whether or not the storm maintains it's strength once it moves into the Great Lakes region. Models are all over the place with the storm but confidence is growing of a disruptive storm somewhere in the plains, that being said, the exact location is still unknown as of now. So what does the long term future hold? Looking much further ahead, we can't predict individual events that'll happen but what we can predict is large scale changes to the atmosphere and from that we can create an educated guess on how that will change the weather over a certain location using previous analogs to that event. The event in particular that will likely spice up the weather around Chicago is the potential Sudden Stratospheric Warming (SSW) event that is becoming more and more likely each day. While I won't delve too deeply into the inner workings of a SSW, the general idea is that when the winds at 10mb over the North Pole which usually flow west to east flip directions and flow from east to west in some capacity, while warming the temperature at high altitude, this constitutes a SSW. Since temperature within the Arctic Circle will warm, it'll force the area of really cold temperatures (Polar Vortex) elsewhere in the Northern Hemisphere. For this particular SSW, the effects are still unknown because it's far too early to know where the Polar Vortex (the area of cold temperatures) will end up. If it ends up over North America, it'll cause temperatures to be much below average and potentially bring a much more snowy environment or it could end up over Europe and causing a mild winter over much of North America with little snow for Chicago. The SSW will occur sometime in the next 2-4 weeks but the effects at 10mb won't propagate downward for a while so the effects won't be seen until mid to late January at the earliest. The last major SSW was in January 2019, which caused the temperature in Chicago to go below 0 degrees for 52 straight hours in late January. A lot could change over the next couple of weeks but the general pattern should remain the same. 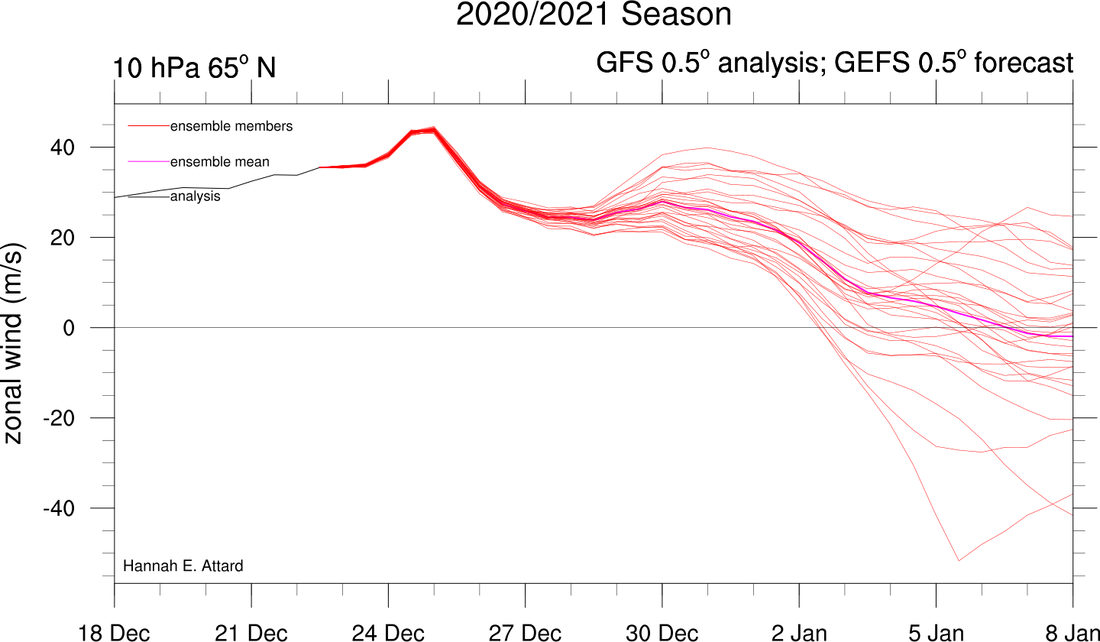 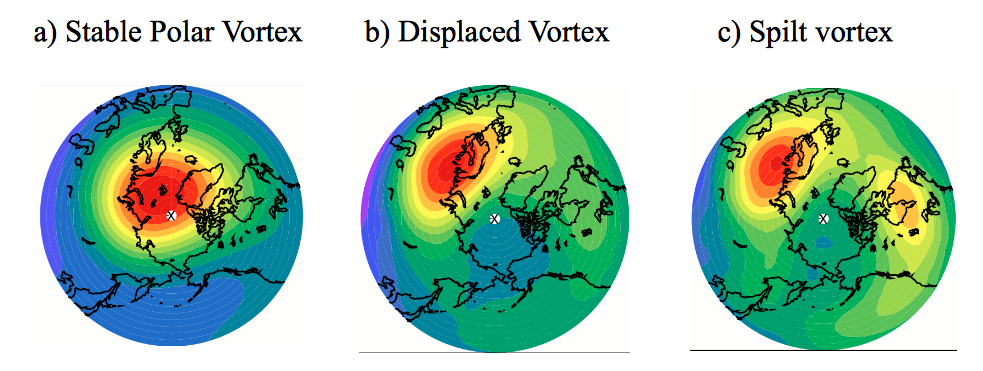
0 Comments
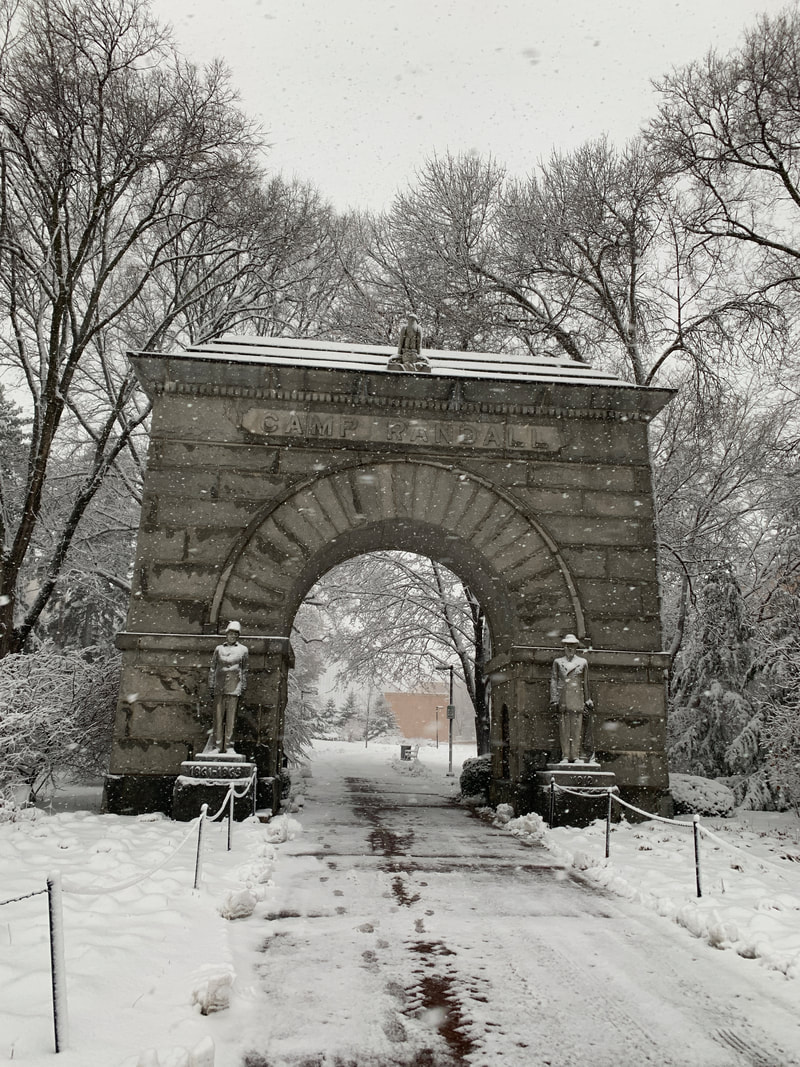
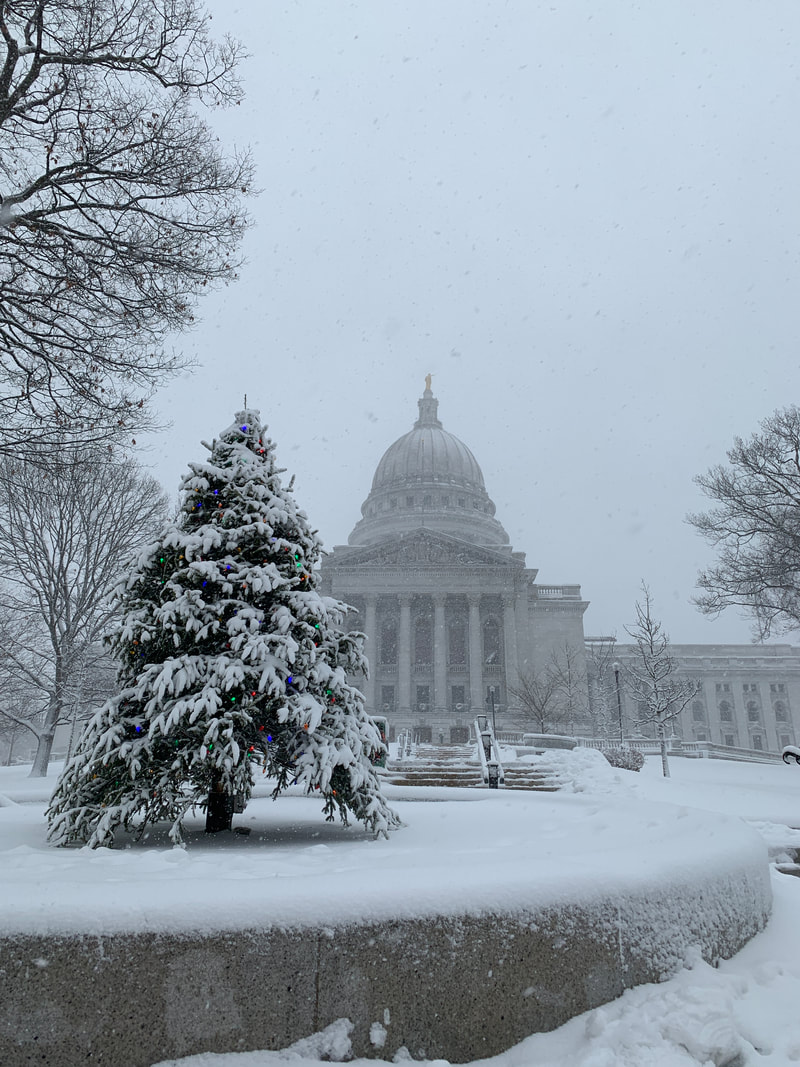
I'll start off the bat and say it's been a while since I've written to the blog, and that's on me. I know I rarely posted beforehand but I hope to get some blog posts out more frequently rather then once every six months from here on out. There were two main reasons why I stopped writing after June. The first is that for much of the late summer and fall, there wasn't any interesting weather for me to write about. Obviously the tropics were record setting this year but with that being said, most of my thoughts were written on my twitter page where some longer threads were mixed in as well. The weather in the midwest was dry, warm with little storm system trekking through. Closer to home, there was nothing notable outside of the August 10th Derecho and a few severe weather busts to even really talk about. With the onset of winter and winter weather, I should be able to talk about a few of the more notable events and/or scenarios in the Midwest/Great Lakes region where I can add my own input and analysis. The second reason why I didn't write was that my time to do longer and more intensive research was interrupted by the ongoing COVID-19 pandemic which killed my motivation for external activities. This was on top of doing my normal school work so I didn't really want to do anything. With my finals for the first semester over, I should have much more time over Winter Break to write a few more blogs. Some upcoming blogs that I plan on having done either by the new year or soon after should be my retrospective view on my hurricane season prediction that I wrote at the season's begin. Another blog would be my season in review for my severe weather chasing adventures in my first year. I have some other blog ideas but I'll definitely put out those two aforementioned blogs along with some more in-depth analysis of some teleconnections that I've kept an eye over the past few weeks. For the future I hope to be able to balance my writing with everything else better so that these long breaks aren't seen again. Here's a couple images from the snowstorm this past Saturday that dropped 5-8 inches of snow over parts of the Midwest. Here in Madison we received upwards of 6 inches of snow with snowfall rates approaching 1 in/hr at times.
Introduction Hello all, as the bulk of Hurricane Season quickly approaches, I thought I would stop procrastinating and finally create my seasonal forecast for the 2020 Atlantic Basin. The official start date for the basin is June 1st and the official end date is November 30th, however storms can form outside of those defined boundaries as we saw with Tropical Storms Arthur and Bertha. In this forecast, I will talk about some of the key indicators that drive the activity in this basin and what they are showing for this upcoming season. In addition, since I’m merely a college student as well as this being the first seasonal forecast that I will have made, don’t take this forecast for verbatim, use it more as a reference or guide. Most importantly, make sure to always follow your local NWS office or the National Hurricane Center for the most up to date forecasts on tropical cyclones. My Predictions For the 2020 Atlantic Hurricane Season I’m expecting an above-average season with an increased number of storms as well as a higher than normal Accumulated Cyclone Energy (ACE) for the season. Named Storms: 15-19 | Yearly average of 12 Hurricanes: 7-10 | Yearly average of 6-7 Major Hurricanes: 3-5 | Yearly average of 2-3 ACE: 160 (+/- 20) | Yearly average around 106 El Niño Southern Oscillation To start off, I’ll talk about what most people have already heard about, the El Niño-Southern Oscillation (ENSO) state or more commonly known as El Niño or La Niña. Whether or not we are in an El Niño or La Niña state will have large impacts on the weather in all reaches of the globe. In simple terms if we are in an El Niño regime, that means that the waters directly west of Peru extending into the Central Pacific are warmer than average, and vice versa with a La Niña regime, the waters would be cooler than normal for that part of the ocean. As a result, precipitation, wind and temperature across the globe are all affected by this phenomenon. Figure 1 shows how convection in an El Niño state can create more uplift and convention over the Pacific Ocean while in La Niña convection moves further east towards the Atlantic basin. Going back to the current state of the Pacific, it’s currently neutral, neither in a warm El Niño or cold La Niña phase. The Climate Prediction Center (CPC) predicts that by the peak of the Hurricane Season in August/September or October, a La Niña may form, or neutral-cool conditions will persist (Figure 2). I believe that we’ll be in a weak La Niña by then as in figure 3 due to an easterly wind burst (EWB) the sea surface temperatures (SSTs) are already dropping in the main region where we measure the ENSO state. With a La Niña environment, we will see increased easterly trade winds (winds that move east) over the Atlantic which would help to reduce shear in the Main Development Region (MDR). With a La Niña environment the trade winds will warm up the Indo-Pacific pool which promotes rising air in the region which enhances the walker circulation which in turn would enhance the La Niña even more. 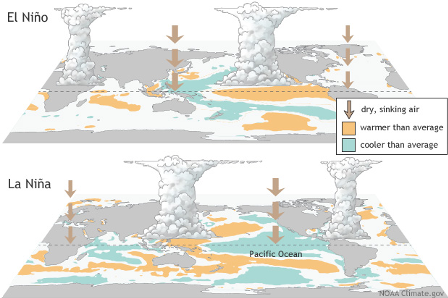 Figure 1 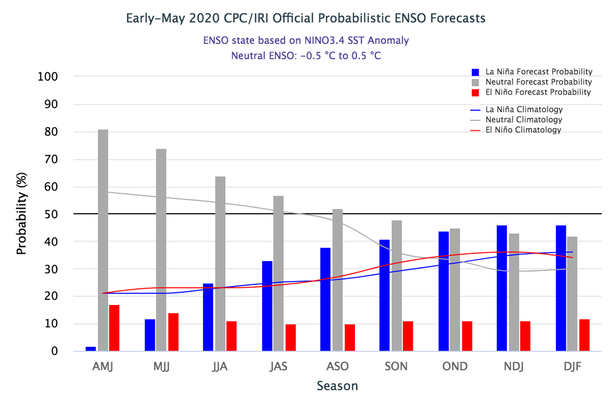 Figure 2 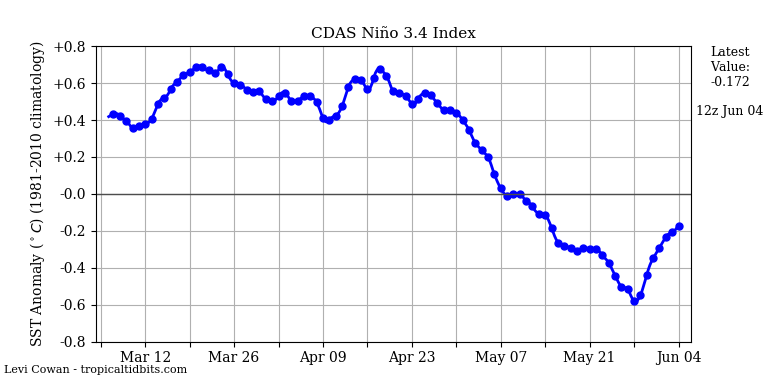 Figure 3 Sea Surface Temperatures Sea Surface Temperatures, often shortened to the acronym of SSTs tells us how warm or cold a body of water is. This is important because Hurricanes and most tropical storms require a minimum of 27 Celsius or 80 degrees Fahrenheit to form or develop. The warmer the waters, the more likely a storm is able to intensify as tropical cyclones use evaporation in their latent heat release to fuel themselves and the warmer the water, the more water that can evaporate for latent heat release. In figure 4 we see that the Atlantic for the most part is around to normal to slightly above normal in terms of SSTs. The main things to notice are that the subtropics are warmer than normal, while the MDR is a mixed bag and the Gulf of Mexico/Caribbean is warmer than normal. Once the West African Monsoon (WAM) gets going, we may see a warmup of the MDR right before the main tropical cyclone season which begins in July and August. The WAM is a term used to describe the monsoon type climate that affects Western Africa like the name implies. The reason why it's so important is because it helps with providing the Atlantic basin with more robust tropical waves which can either survive longer or are already organized once they leave the continent. Due to a more active West African Monsoon (WAM) which is due to an anomalous SST gradient between the Equator and 20N, it’ll enhance a favourable trade wind pattern that will create a more active WAM, alike to 2019. That being said, the Atlantic may warm or cool on a moment's notice as we saw with the GOM. In mid-April it, was at record warmth and then a month later it was much cooler. Factoring that in, I still believe that this general pattern of a warm Atlantic will stick around for the August/September/October time frame (The heart of the season) which would allow for a more active season. 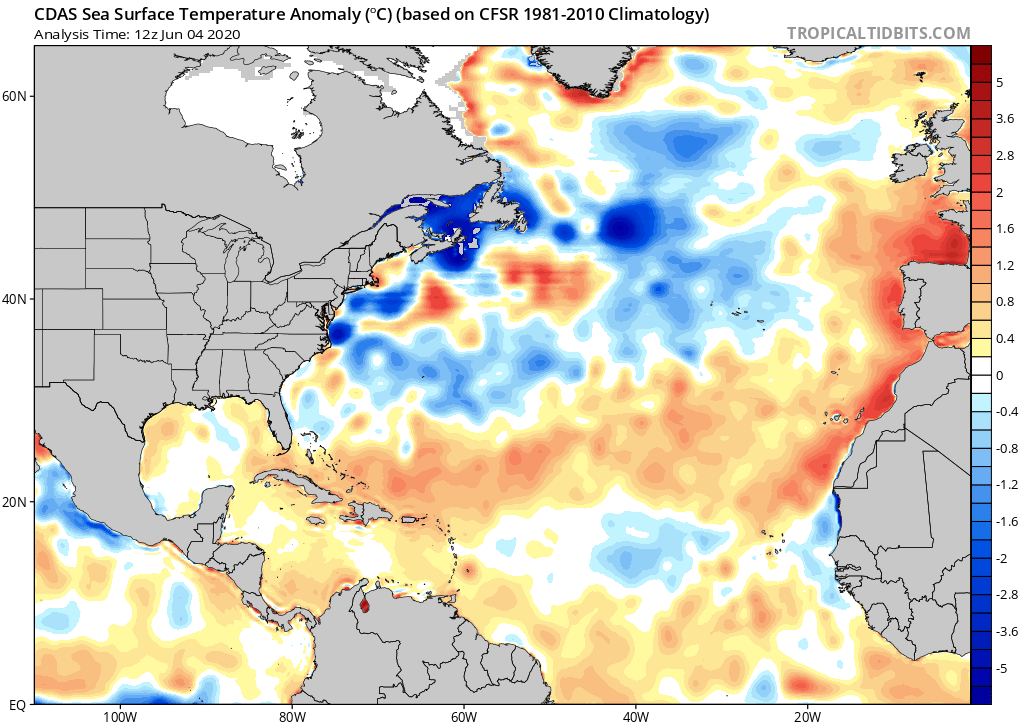 Figure 4 Atlantic Multi-Decadal Oscillation The Atlantic Multi-Decadal Oscillation (AMO) is a process of variability which takes about 60 to 80 years to complete a full cycle. It is determined by averaging the SSTs of the North Atlantic from the equator to the Arctic. In figure 5 we see that about every 30-40 years the AMO switches from positive to negative or vice versa from negative to positive. You may be asking why is the AMO important? Well, the AMO can be used to help predict the climate in North America and Europe, ice anomalies and in this case Hurricane Activity within the basin. There is a strong correlation between there been more active years in positive AMO years and less active in negative AMO years as shown in figure 6. As we are currently in the warm phase of the AMO, this lends credence to the possibility of another active year in 2020. Obviously, there are some years where the correlation isn’t as strong such as in 2013 or in 1997, but the overall picture paints a positive correlation between the AMO and the activity in the Atlantic Basin which should continue this year. 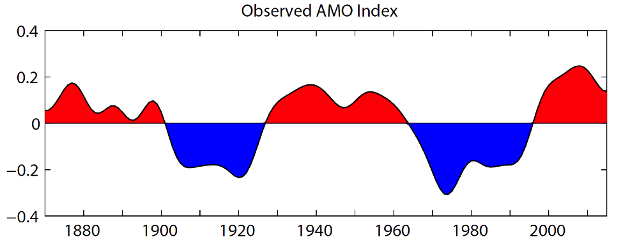 Figure 5 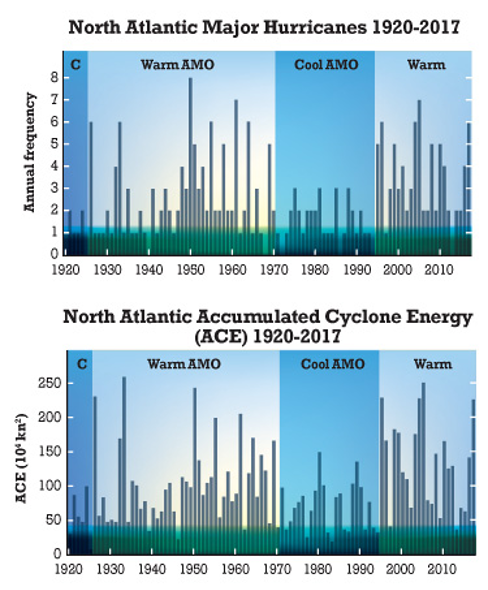 Figure 6 Atlantic Meridional Mode The Atlantic Meridional Mode (AMM) in short is the variations of the SSTs and 10 meter winds within the Atlantic in both the Northern Hemisphere and Southern Hemisphere extending from 21S to 32N and from 75E to 15W. The reason why this is important is because the resulting SSTs difference between the two hemispheres help to move the Intertropical Convergence Zone (ITCZ) towards the warmer hemisphere which would be the warmer basin in terms of SSTs. In addition to this, over the warmer hemisphere, trade winds will be lessened which in turn warms up the water even more to the already warm waters creating a small positive feedback loop. While the latest data hasn’t been updated since March, the AMM value should be higher now as the waters in the data range are above average which would lead to an +AMM which would move the ITCZ further into the Northern Hemisphere. That being said the ITCZ (figure 8) is slightly south of its usual location at this time of the year which would indicate that the AMM is still neutral or even negative for the time being. This isn't a big deal for June or early July as the ITCZ is usually too far south for many waves to take advantage of the position since the coriolis effect (The force that helps tropical storms rotate in a cyclonic motion or counter-clockwise). This becomes much bigger in August and September when most of the storms are born from tropical waves off of the ITCZ and the location of it does matter more. 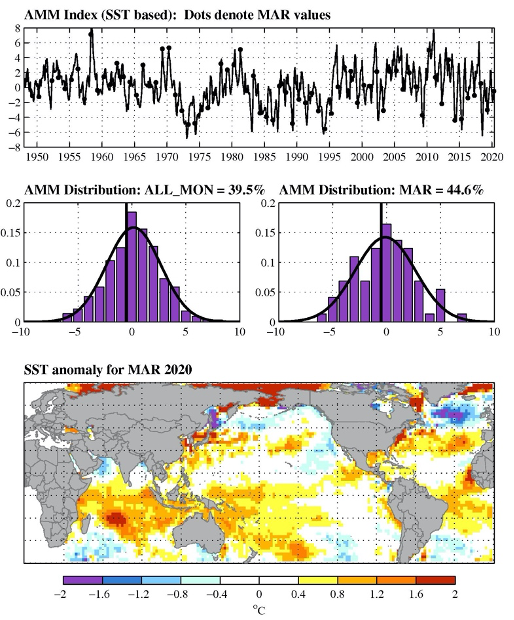 Figure 7 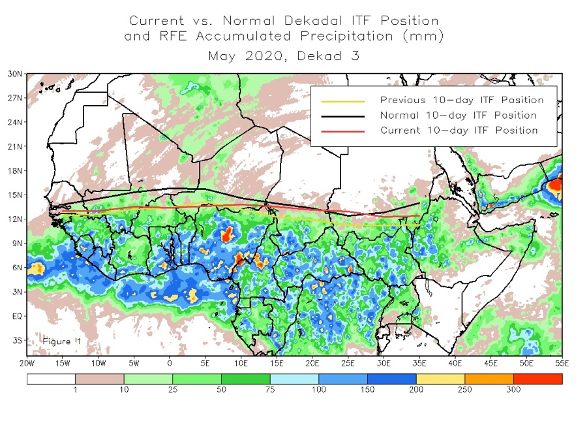
On May 23rd 2020, I went on my first storm chasing trip not expecting much other then maybe some rain and hail, and at best a decent picture of the structure of a mature supercell. What I got may not seem like much to most people but to me, it was an amazing experience. I got to see the birth of tornado albeit a weak one, likely an EFO on the Enhanced Fujita Scale but still an mesmerizing image in my mind.
I originally hadn't planned on chasing on Saturday for a few reasons. These include being slightly worried about the whole Coronavirus situation and how Illinois was still a hotspot for the virus. I also wasn't going to go because I never trust warm front situations in Illinois because more often than not, they don't pan out. March 28 2020 is a prime example of this occurring when SPC issued a MDT risk for Northern Illinois, but convection over Missouri overnight ruined the whole setup. The last reason why I wasn't going to chase was because I had no experience prior to this chasing and to be frank I'm a cautious guy so I didn't really want to chase unless it was a home-run setup and an enhanced risk with a 10% tornado probability doesn't necessarily shout home-run for a newbie like me.
That all changed on Saturday morning when I awoke and had a gut feeling about chasing today and decided to see the feasibility of whether or not it was worth it. I already knew that my good friend Isaac Schluesche (@SlushyWx on twitter) was going to be chasing because he had told me the night before and I thought to myself that "If he thinks the setup is good enough to chase maybe I should look into it" I had major doubts like my aforementioned thinking about Northern Illinois setups. When I woke up I looked at model runs and current observations and they looked very enticing, the warm front was advancing nicely through central Illinois at the time with temperatures around 70 and dew points ranging from 60 to 65. SPC had issued an Enhanced risk for Northern Illinois with a 10% risk for tornadoes earlier that morning as well. So I decided that I would chase if my dad wasn't too busy and could help with the driving, and lo and behold he agreed to come with, so I was on my way to my first chase. 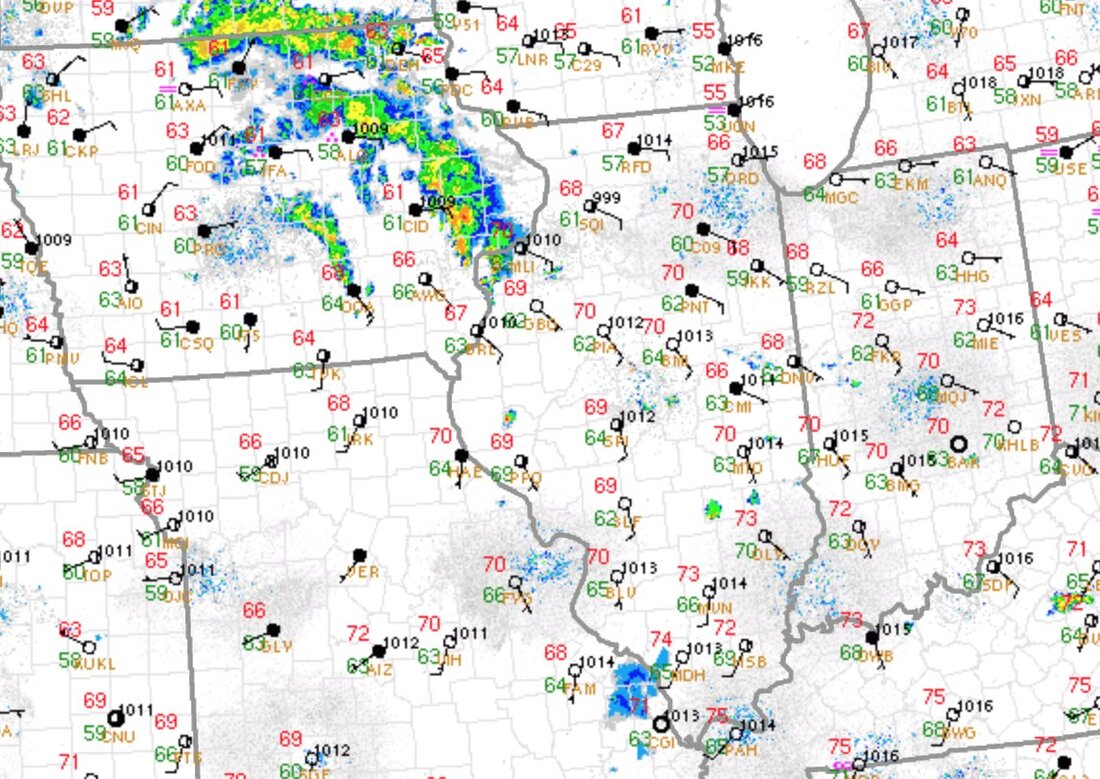
Morning Observations
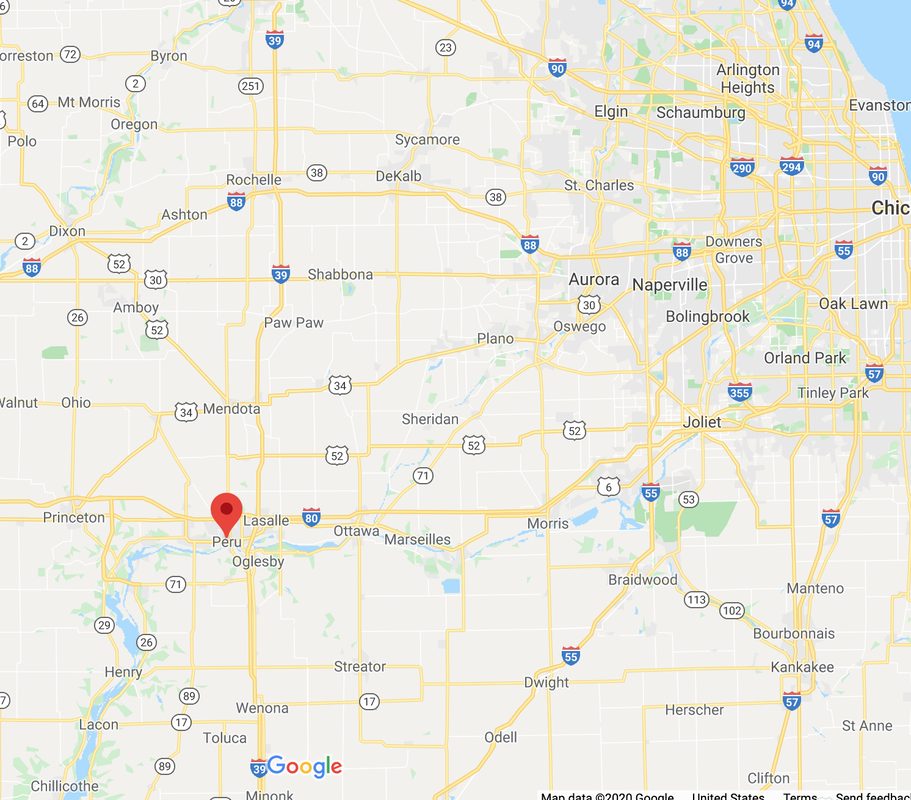
After doing some personal stuff that morning, I started to plan my route and I decided that my dad and me would head west to the I-39/I-80 intersection near Peru Illinois. This would give us good North/South and East/West access depending on where and when storms would fire so I could get there in time. I also choose that area because the town offered some decent food options if we were hungry and had some spare time on our hands. While on route, the SPC issued a Tornado Watch for much of the area with a 70% chance of tornadoes which helped to bolster the case to chase today. We left home around 11:30 and had a just under 2 hour drive there which was pretty uneventful, just some hit some rain showers as we pulled up to Peru where we decided to eat at a place called John's Place which had some very good sandwiches. While we waited for our food I decided to reassess the situation and it seems as though I was in no man's land with storms to my north and to my south. I decided to head North towards Rochelle to get some cheaper gas as well as to target some developing cells 20-30 miles to the northwest which showed some promise.
On the way north towards Rochelle, cell that once showed promised started to fizzle out even though it had decent CAPE, SRH and it was discrete as it was the only supercell within 50 miles of it. When I got to the gas station I had to assess what and where we should go. There were two options on the table at the time, head N towards preexisting cells heading NE towards the Illinois/Wisconsin border, one of which was tornado warned or head west towards developing cells near Walnut Illinois. With some guidance from some of my friends and other storm chasers in a group chat I was in, I decided to take a bit of a riskier path in heading west towards cells that were just developing but had a high chance of having the same fate as the cell prior to these in the same area. Rather than chasing fast moving cells into Wisconsin, I'd rather have the storms come to me so that I could better position myself to get a better view of the Supercell.
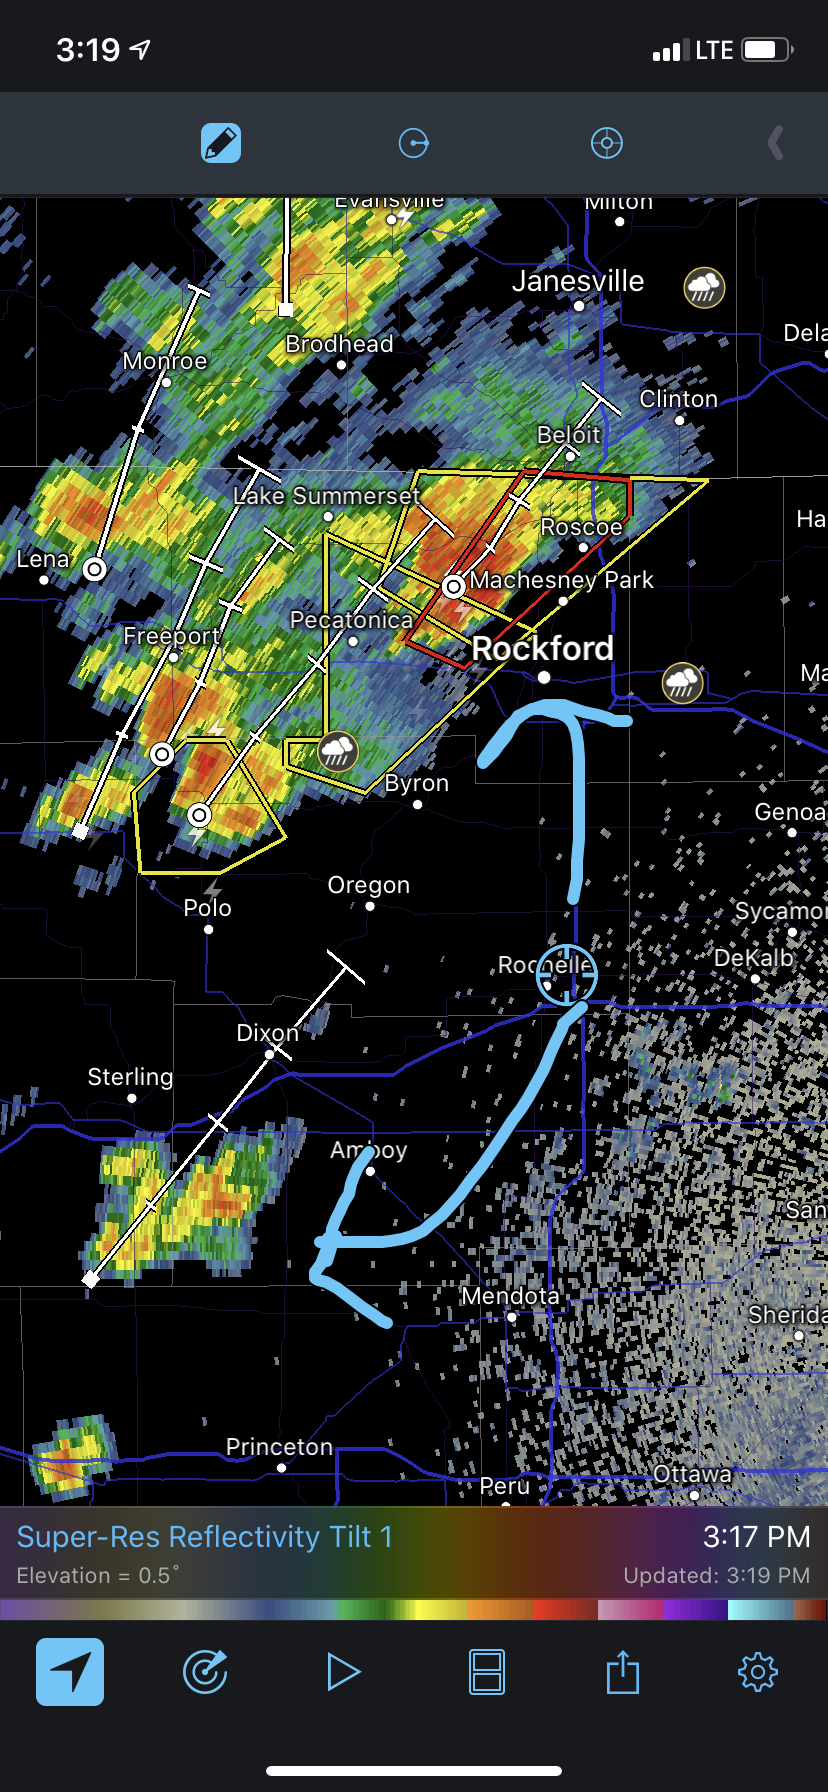
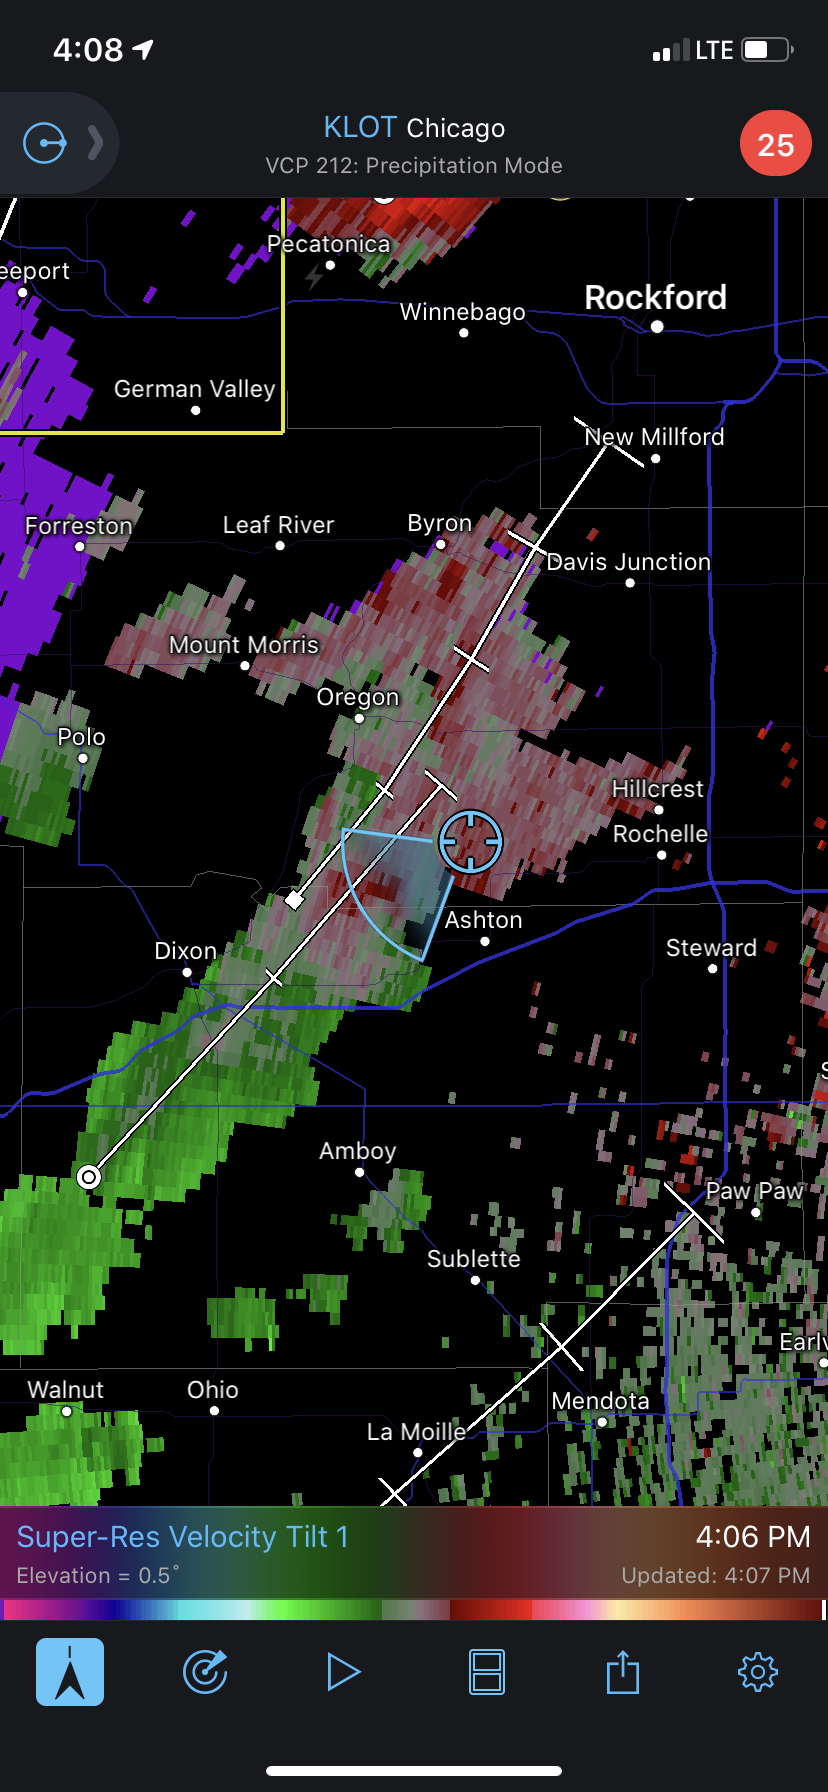
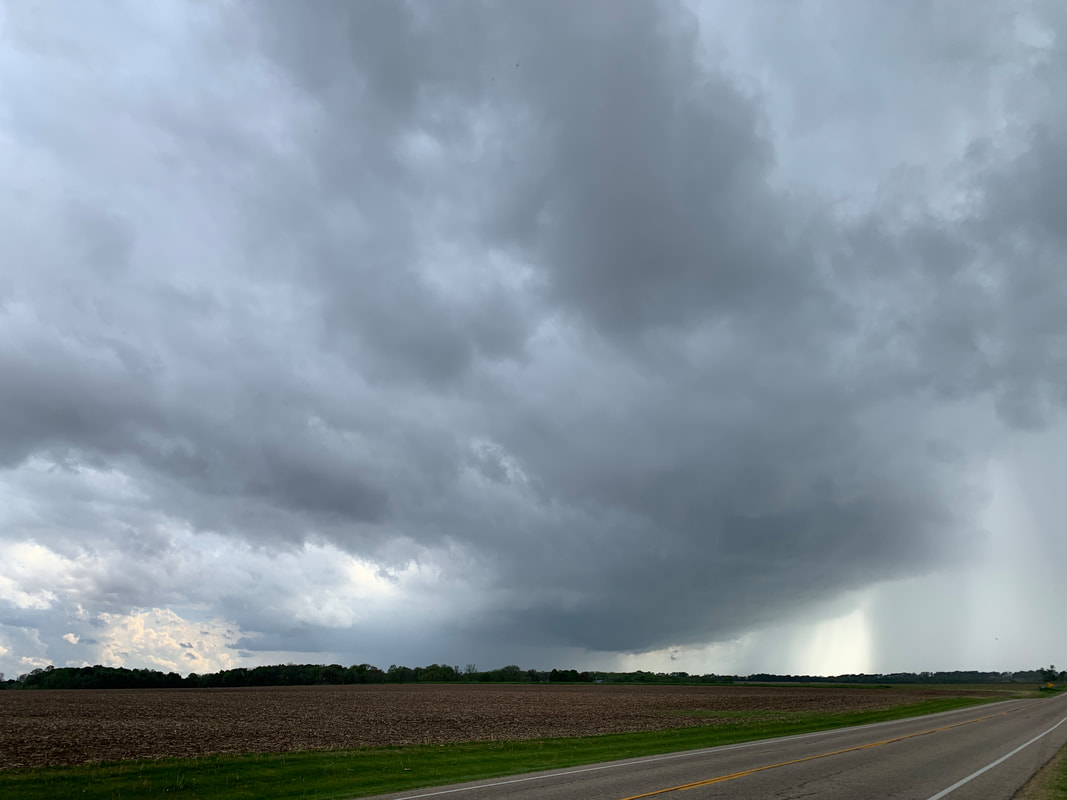
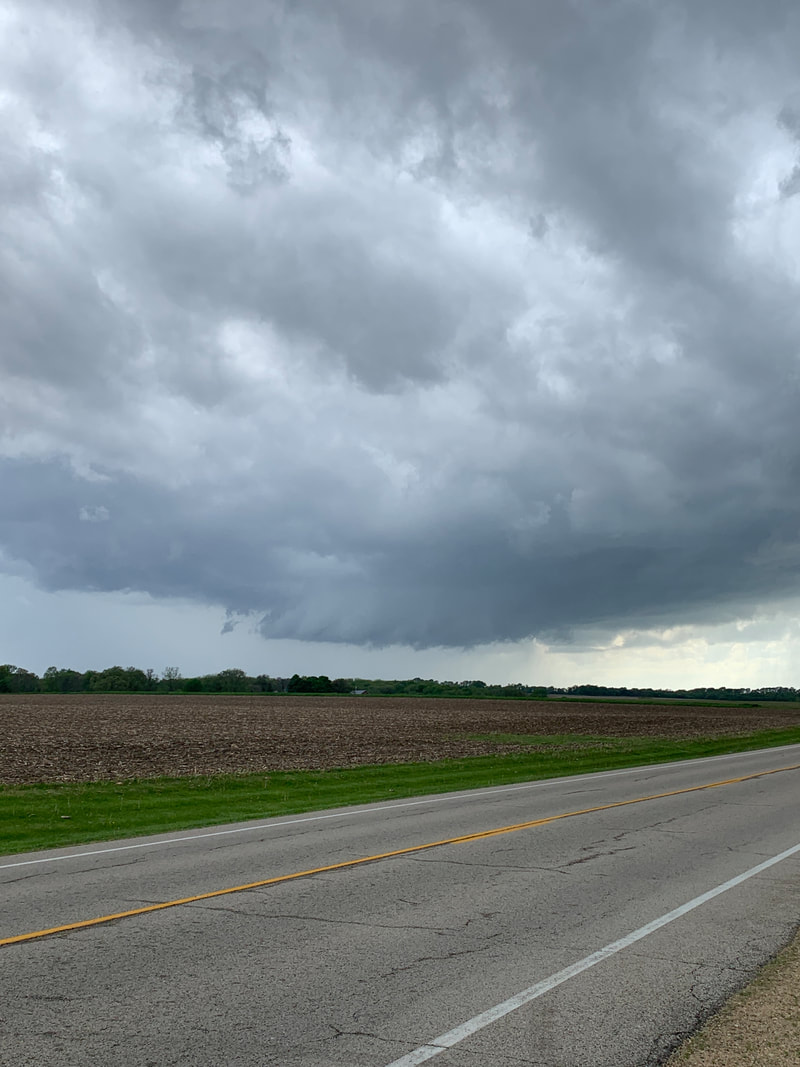
As it turns out, luck and good intuition was on my side as it turns out that that storm NW of Rockford almost dropped a tornado multiple times but never was able to completely complete the job as I learned later that night from Isaac. While that was occuring, the cells to my SW were quickly organizing and my dad and I decided to stop near the town of Chana and wait for the Supercells to move to the NE near our position. The first one showed decent rotation on radar but since the radar site was some distance away, the rotation looked quite broad. In addition, to that, what we were seeing with our eyes didn't look too enticing. That being said, since I'm a new guy to chasing I don't really know what looks good and what looks bad, I was only guessing at the time.
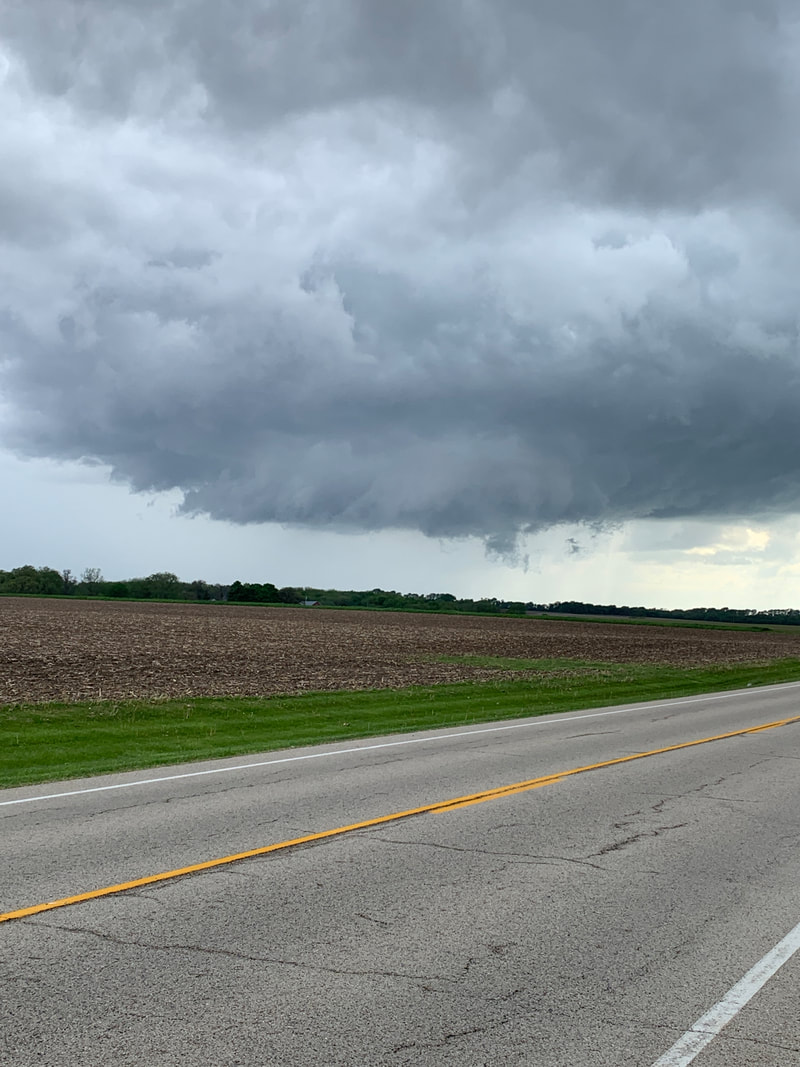
It was about 4:10 when I could see slight rotation of a small wall cloud in the distance which piqued my interest in the cell. As it came closer the rotation became more evident with multiple scud clouds becoming evident as well as general updrafts. As it moved to the NE the wall cloud began to lower which was a really good sign that this cell may produce a twister.
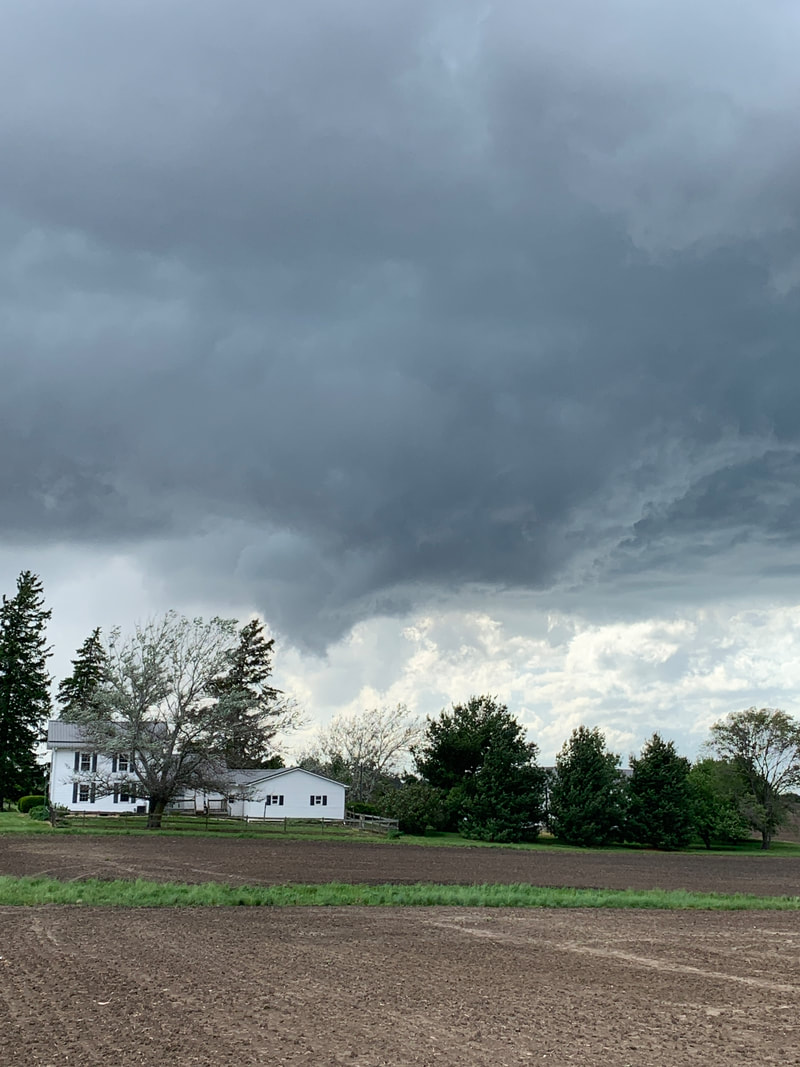
As the supercell continued to move to the NE, it crossed the road and this is when I started to see what appeared to look like a horizontal tube originating from the wall cloud. It eventually became vertically stacked and that is when the funnel cloud emerged. At this point I was geeking out from my vantage point about seeing a funnel cloud. At this time I couldn't see if the there was any debris at the ground because a house blocked my view which would indicate that the tornado extended to the ground but the condensation funnel didn't reach all the way down. However as it continued the funnel became better organized and continue to lower from the initial wall cloud.
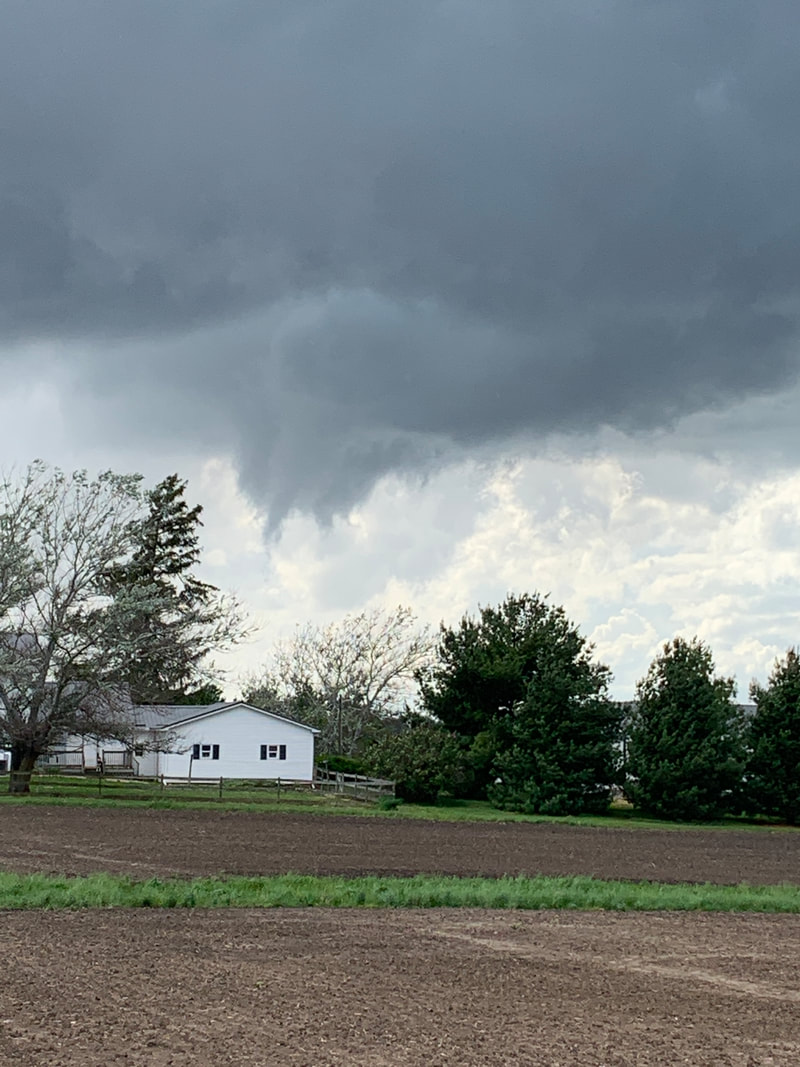
After the funnel cloud moved bit further to my right to the point where I could see it without obstruction, I finally got a good look at it, it wasn't nothing too spectacular to most chasers but to me, it was entracing. I couldn't keep my eyes off of it. It was another 2-3 minutes later of the funnel cloud moving to the NE is when I could actually confirm that this was in fact an actual twister and not just a funnel cloud. Just behind a tree line in the distance I could see what appeared to be dirt/dust and leaves be blown off in the distance under the funnel cloud which confirmed the Tornado status to me at least. I say that because as of May 25th while I'm writing this post, NWS Chicago hasn't officially confirmed the twister but mentioned that a quick spin up was possible.
I can't post the actual video on weebly, but if you click on the link below, it should bring up my twitter where I posted the video where you can see the Tornado with some brief debris in the distance.
https://twitter.com/ReaperofCanada/status/1264321193890459649
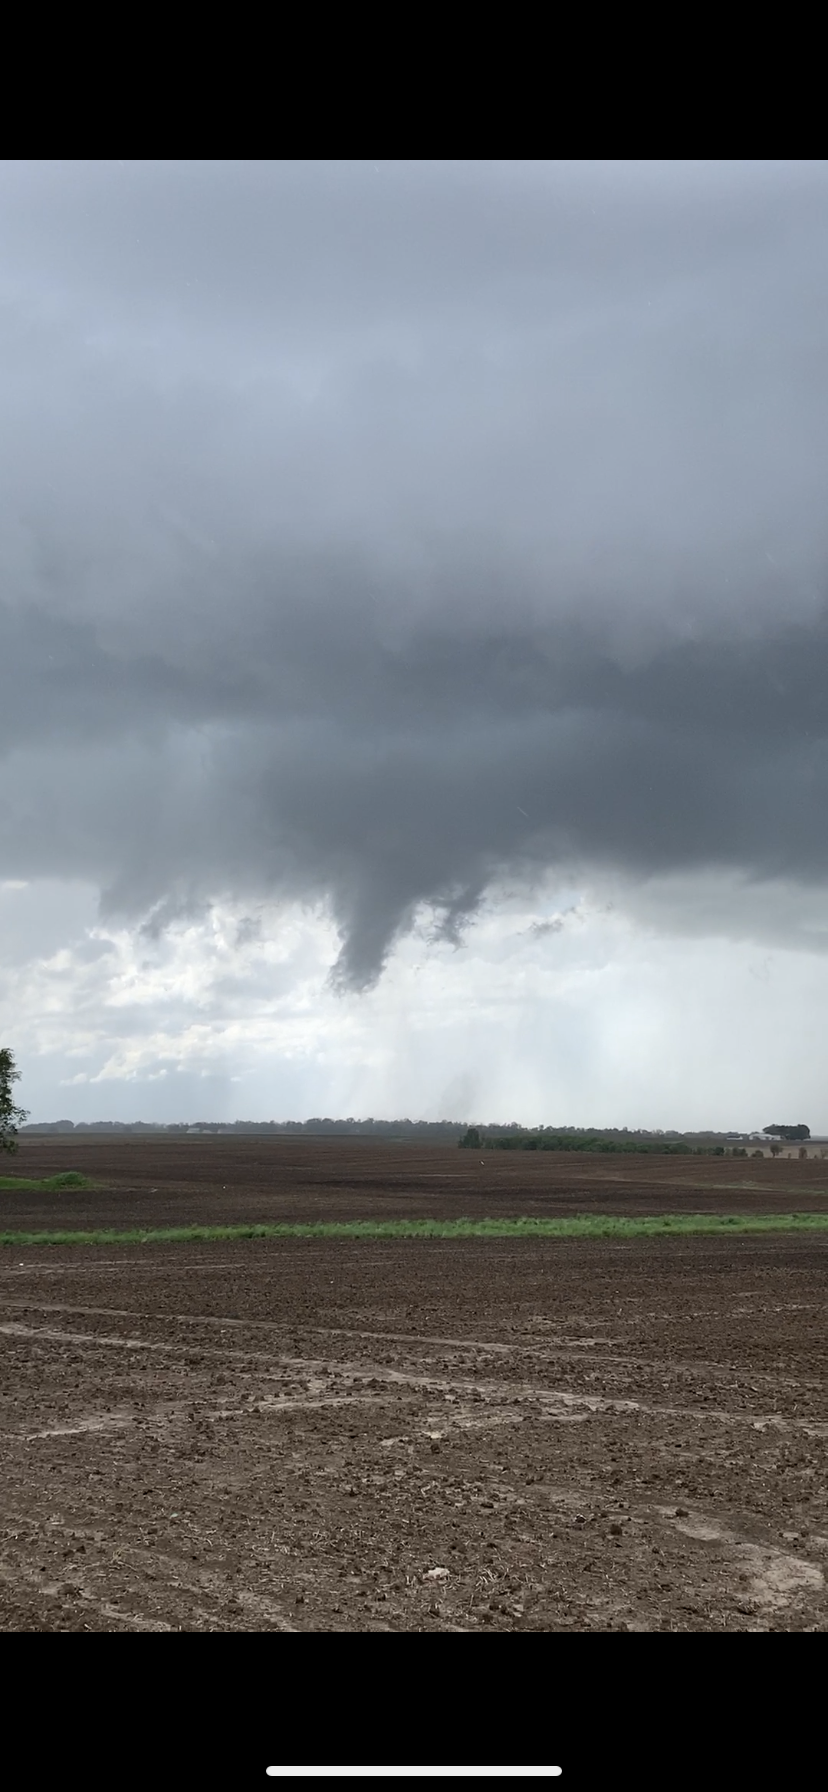
Here is a still from the video above with the debris kinda visible in the background
A couple minutes after I recorded that video, the funnel cloud retracted and all there was a wall cloud whose structure was rapidly deteriorating as it moved away from me. My dad and I decided to follow it for the next 30 minutes to see if anything would happen but the wall cloud by that point was just hidden in rain and the rotation on radar was nothing more, so my dad and I decided to head home at that point around 6. While on the way back we drove through the "Hail Core" of a storm and while there wasn't any hail associated with it, the rain was so heavy we could barely see 50 feet in front of us on the highway. What a way to end the trip.
All in all 300 miles, about 7 hours and 1 tornado on a trip that I had no expectations was more than worth it. It was very successful first storm chasing experience and now that I've broken the ice, I'm going to attempt to chase more from here on out in my area. A lot of credit goes to my friend Isaac as well as Erik, Nick and Logan who helped with tips throughout the whole trip.
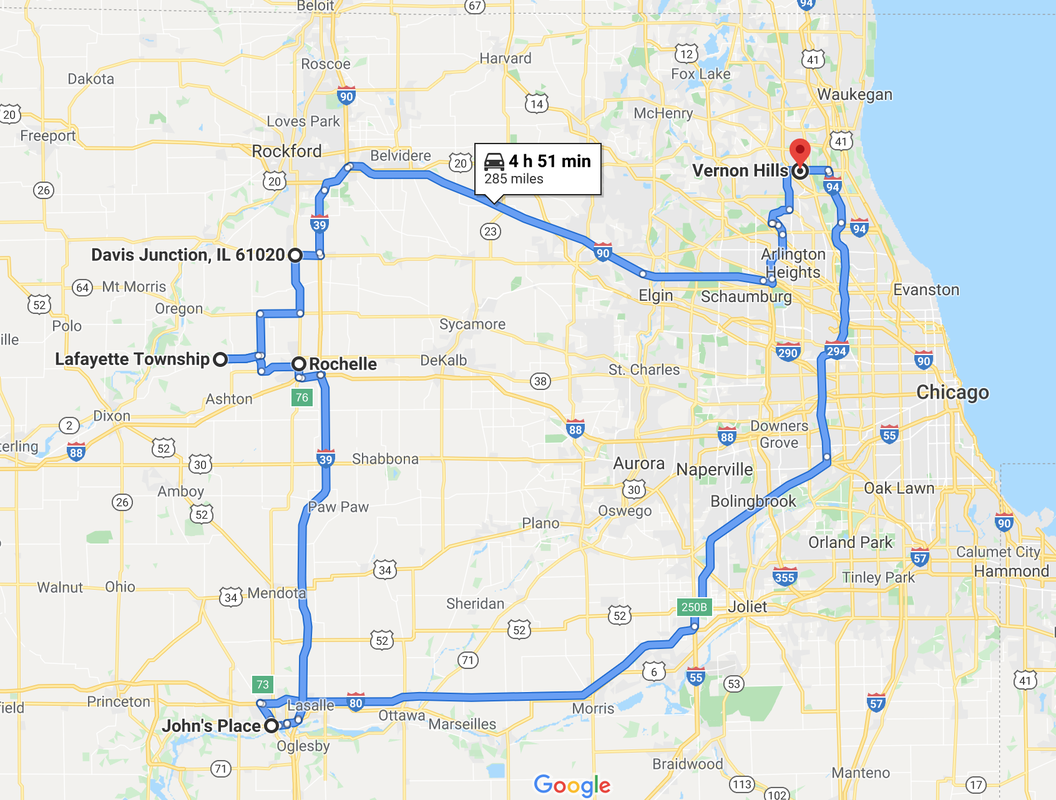
The route for the day
My next blog post will be my forecast for the Atlantic Hurricane Season which will come out in the coming week.
Welcome to the Website, I will be occasionally writing about interesting weather events, seasonal forecasts and anything else weather related. The site is currently still a work in progress so what is seen and what will be here will change. For now I have put the basics, some quick links to some important pages as well some cool photos I've taken throughout the years. I thought I might write about something interesting today as a a day one special, however, they aren't that many interesting weather events currently going on. Instead, I'll just show off the graph I made yesterday night on Hurricane ACE from 1950 till today and talk about it. 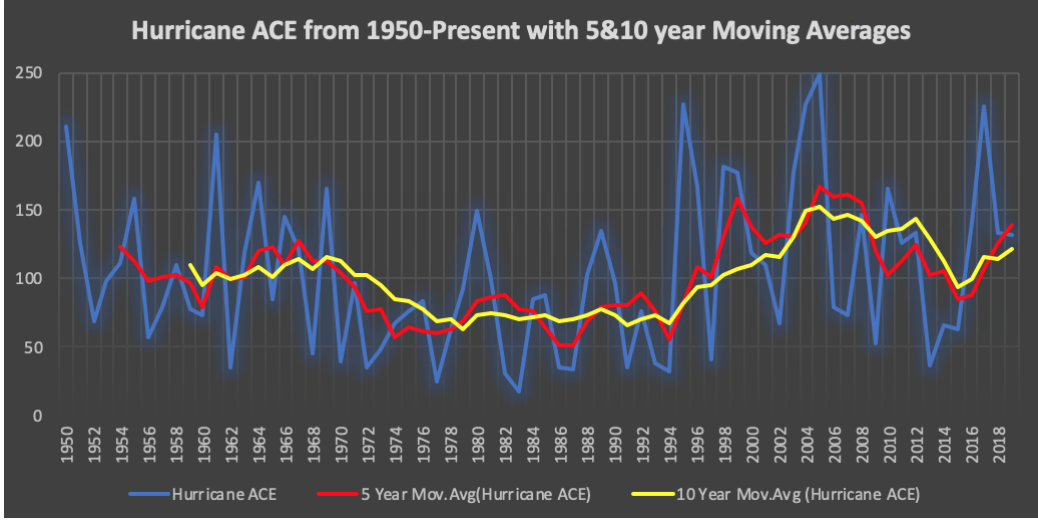 Here we can see the hurricane ACE of each individual season in blue and the 5 and 10 year moving average in red and yellow respectively. There are a few things that come to mind when looking at this chart. First of all we can see active periods and the inactive periods quite easily when looking at the moving averages. We can see that both the 5 and 10 moving averages went below 100 for most of the 70s and 80s denoting an inactive/cold period for the Atlantic. On the flip side we see that in the 50s/60s as well as since the mid 90s it has been mostly above 100. This coincides nicely with what we saw in 1995 when the Hurricane ACE was over 200 which corresponded with beginning of the current active period. Something to note is that numbers in the 50s and 60s may be a little lower than what they actually represent due to underreporting due to the lack of proper satellite imagery and some cases the complete lack of imagery. So that means the numbers prior to 1970 may be higher than what the graph shows. CSU released their April Prediction for the upcoming Hurricane season and they're predicting that we should quite active season ahead with ACE around 150 which would more than what we saw in the last two years. They are predicting for 16 named storms, 8 Hurricanes, and 4 Major Hurricanes this season. The average for each of those values are 12 named storms, 6 Hurricanes, and 3 Major Hurricanes for a normal season. My own prediction is somewhere in the range of 14-18 Named Storms, 7-10 Hurricanes and 3-5 Major Hurricanes, which is fairly similar to what CSU has predicted. I may make my own forecast in the coming future so stay tune for that in future blog posts.
|
AuthorHello, my name is Kaylan. I'm currently a sophomore at the University of Wisconsin studying Atmospheric and Oceanic Science. I have had a passion in the weather for as long as I can remember and hope to continue it into the future. Archives
December 2020
Categories |
 RSS Feed
